This blog is the third of a series of articles that will introduce our readers to Marketing Mix Modeling (MMM), a proven marketing and ROI measurement technique.
MMM has stood the test of time and is today leading the way of highly granular and privacy compliant marketing measurement techniques.
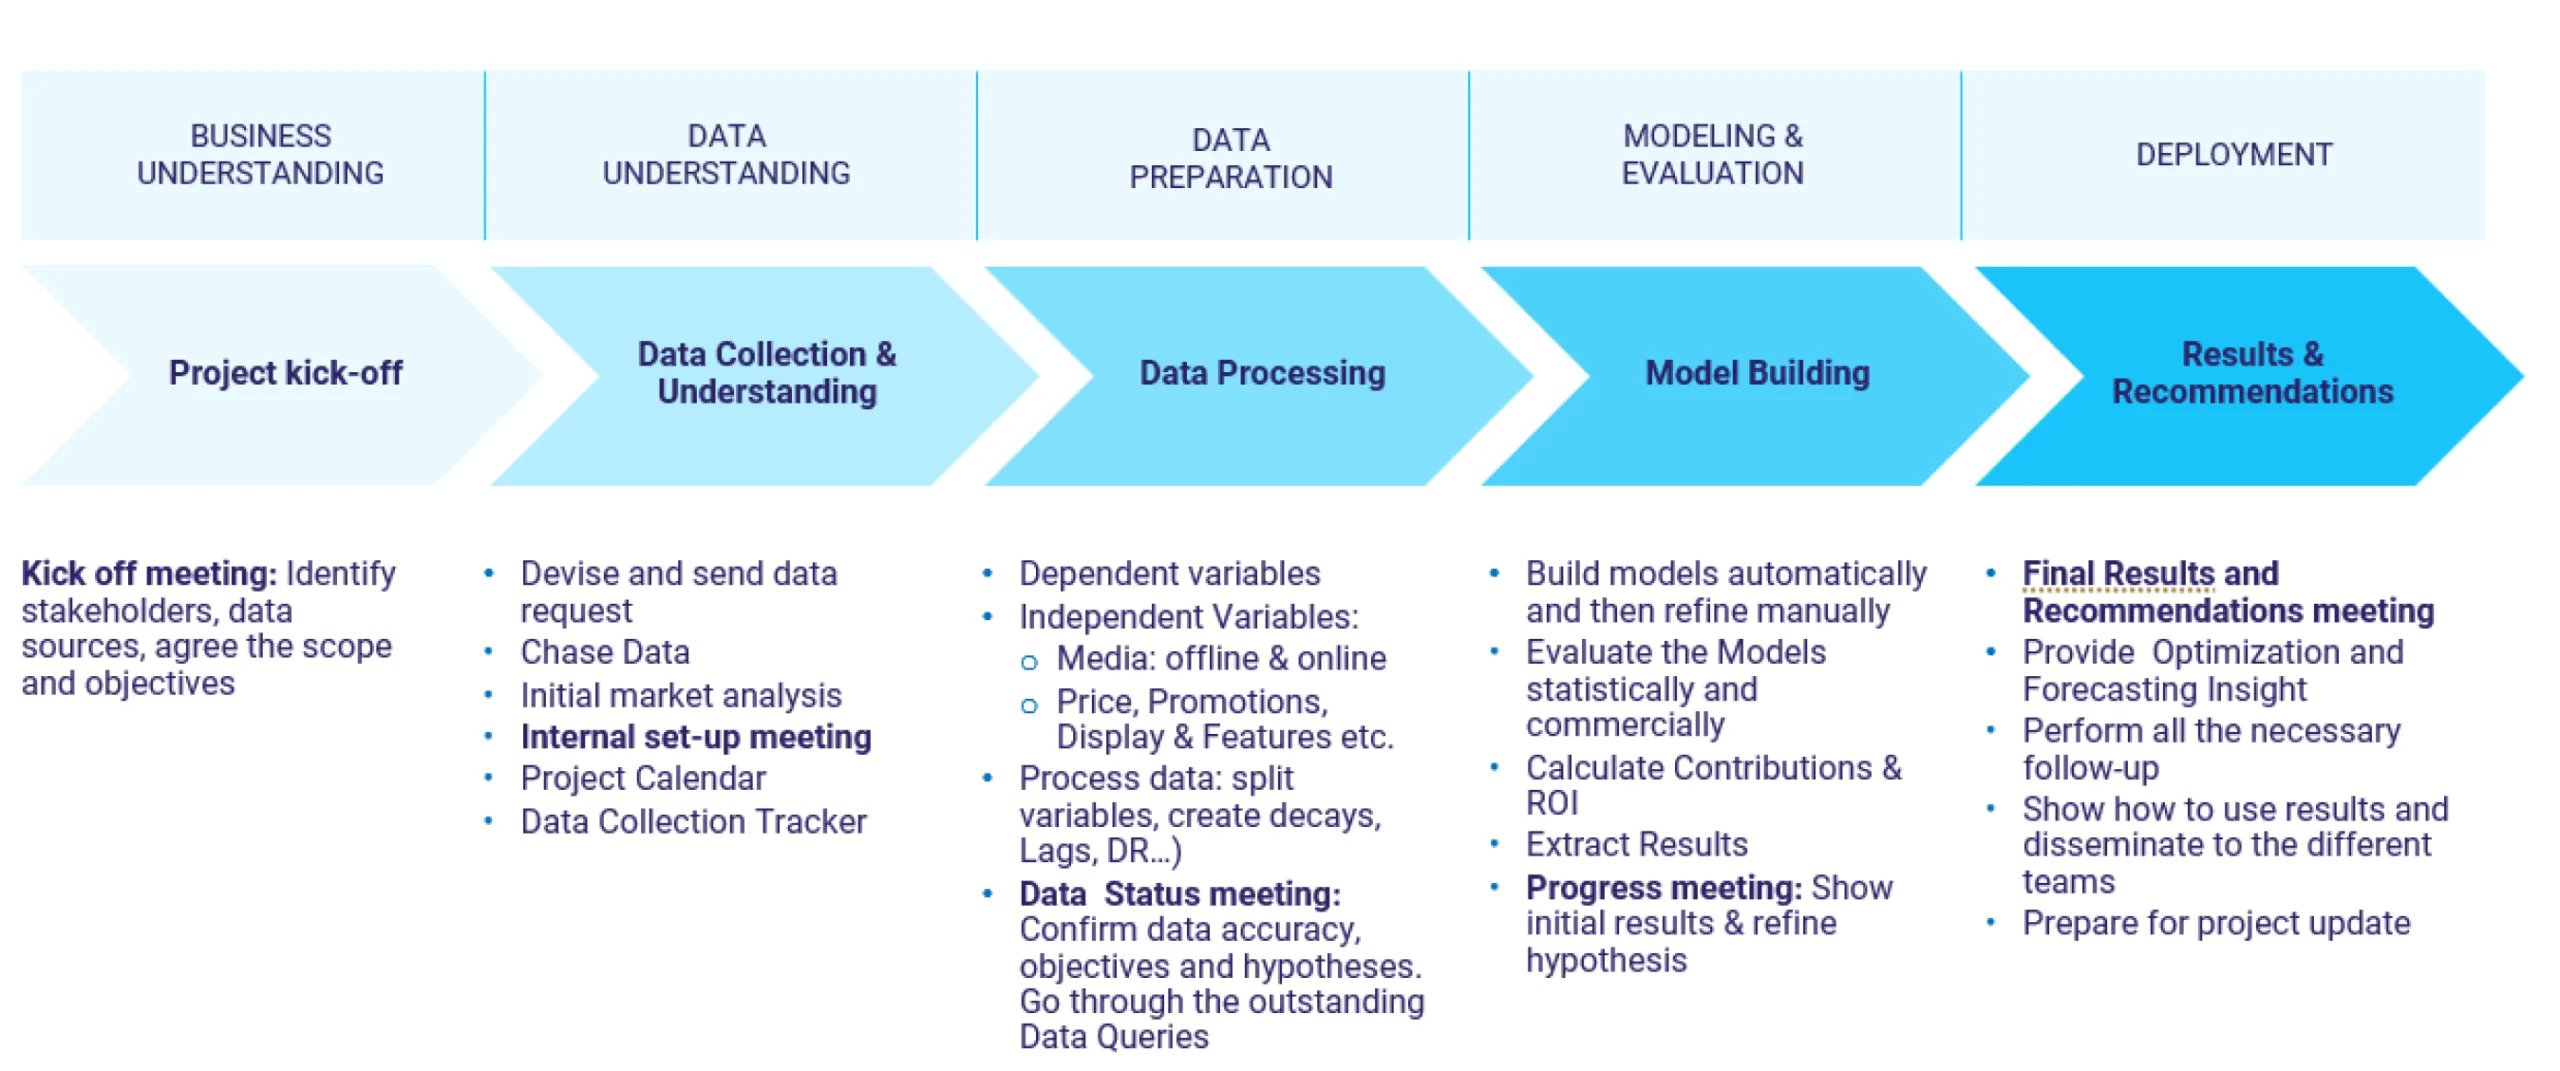
In the previous article from this series, we discussed the workflow that guarantees the success of a Marketing Mix Modeling project. In this article, we are moving to the data that the analyst needs to collect to get their MMM project off the ground. The Data Collection step falls in the second position in the MMM workflow chart, and it starts with the Data request.
Data Request
This phase is initiated by requesting the data necessary to achieve goals that were set during the kickoff meeting. The more data there is, the more granular the analysis will be. The key to the success of Data Collection is the tradeoff between requesting as much data as possible and not burdening the client (or internal team) with extracting data that is unnecessary for the project. This step is especially important to establish much needed coherence between the data and the business questions.
→ The details of the request are in the form of a document called Data Request, and it encompasses the following:
- The Category: TV data, search data, display data…
- The Level of Granularity
- A Description of the Data. For example, if it is search data, should it be impressions, or clicks or both?
Data Sources
Data is usually collected from multiple sources. And it is crucial for data to be cross-checked.
Example: If the analyst receives impressions, clicks, and spend data, the first thing to do is to chart spend against the number of clicks and verify that the ratios between these variables make sense.
Data Sources
Response Data (KPI)
Subscriptions/ Sales/ Acquisition:
- Split by branch/ store/ region
- Split by new/ existing
Source: Client
Marketing Activities
- Price / promotions
- Sales
- Incentives
- Local activities
- DM
- Door Drops, etc.
Source: Client
Paid Owned, Earned Media
- POE Media Activity: online and offline (spend / ratings, etc.)
- Competitor’s activity (gross spend)
Source: Client
External Factors
- Market Trends
- Seasonality
Source: Client
KPIs
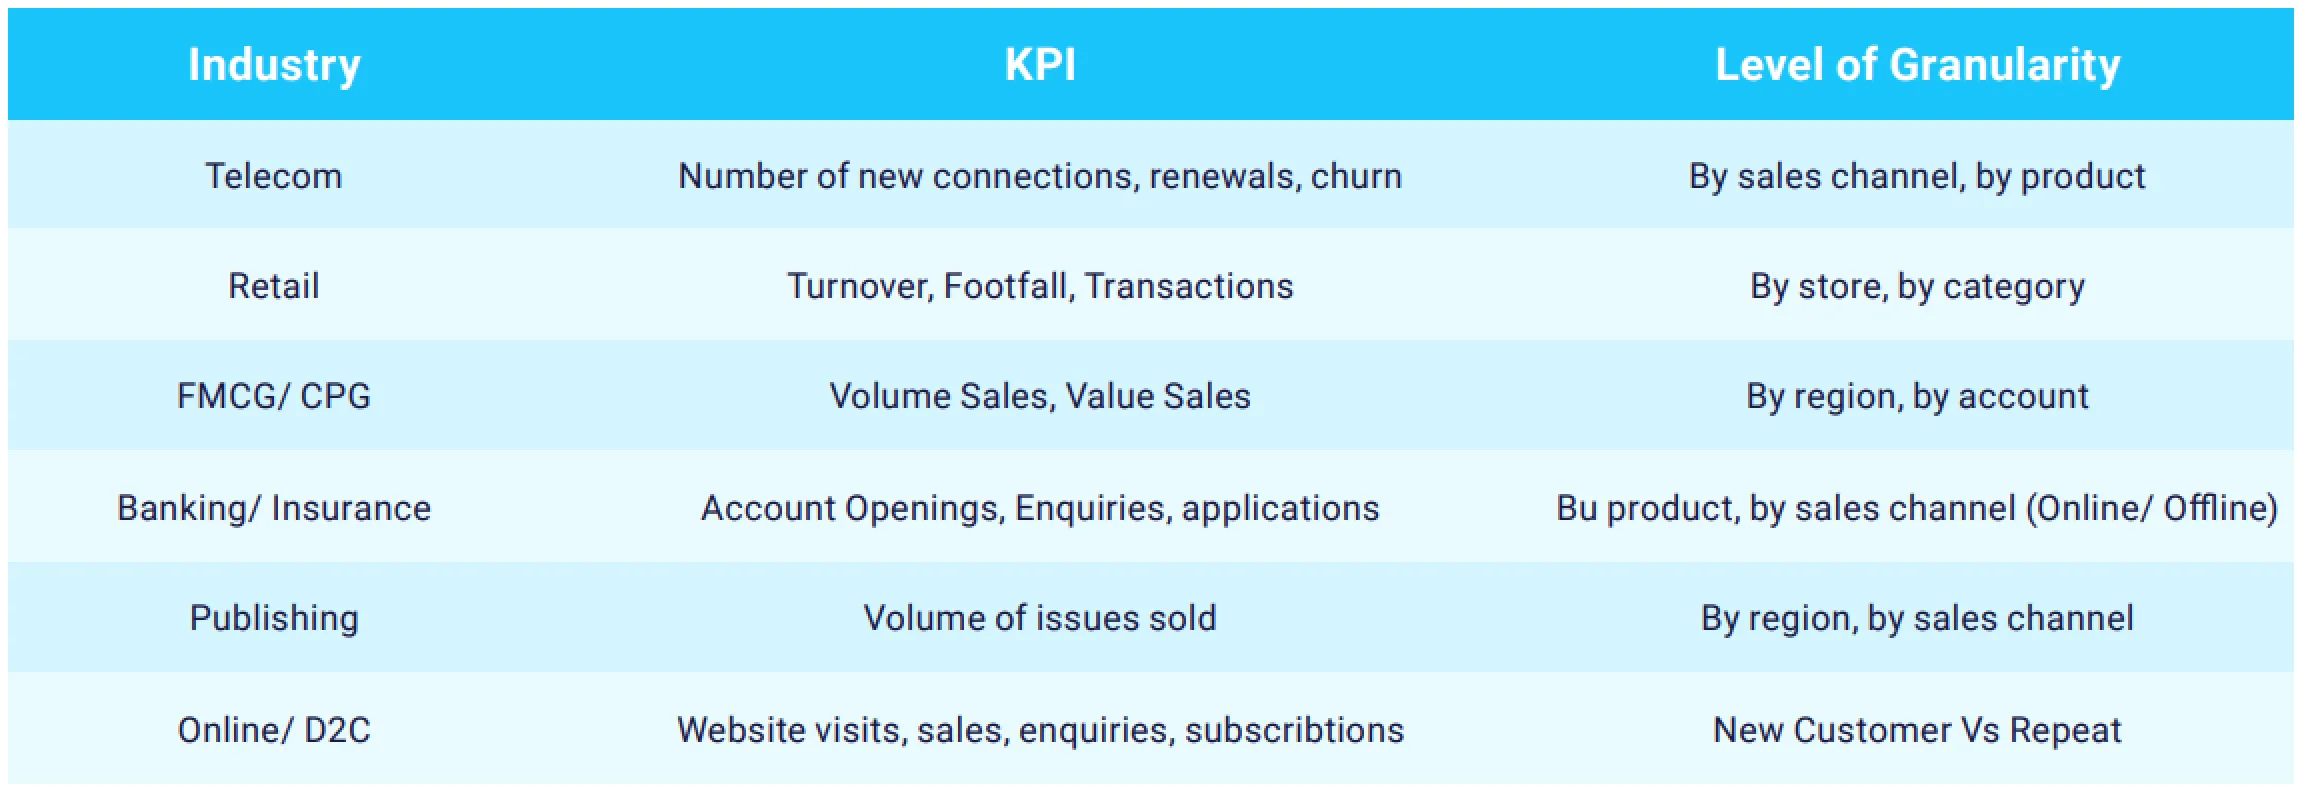
In statistical terms, the KPI to be modeled is called “the dependent variable”. Without it, there will be no Marketing Mix Modeling project. This type of data should be collected at a highly granular level if that is possible, even if the modeling is done at the national level! Also, Dependent variable data should be collected at the very start of the data collection phase of the project.
The following table illustrates some of the KPIs that are used in different industries:
Marketing Data
This is any type of data that relates to the marketing activities (media excluded). It includes:
- Price: The data analyst should know the real price (the same applies to regular price and shelf price if what is modeled is a CPG/FMCG brand). At the same time, they should collect data about the prices of the competition, so they construct relative prices, based on which, they analyze the impact of raising/ lowering prices on sales.
- Promotions: This refers to the different promotional mechanics that are used. In the context of a CPG/FMCG brand for example, it could be:
- Buy one, get one free
- Multi-buy
- A price reduction
- Direct marketing (DM): These activities should be classified based on whether they are hot, warm, or cold DM activities. They could also be classified by campaign, for example, promotional DM campaign, as opposed to non-promotional DM campaign.
- Salesforce: A telecom operator, for example, whose activity mostly runs through stores, needs to understand the number of salespeople that are in the stores, their level of qualification, and the amount of commission they are offered when they sell phones.
- Distribution: The analyst should be aware of any new store opening, closure, or refurbishment, in case of a retailer. If they are modeling a CPG brand, it is important to know whether the brand distribution is increasing or decreasing and define the new outlets that are selling the product at that moment.
- Product: Sales could be influenced any changes in the packaging, or the formula; any addition to the flavors; any launches, or delays, all these changes in the product. Therefore, the analyst must remember to collect every single piece of data about anything that has been done in terms of marketing activities.
POE (Paid, Owned, & Earned) Media
- Paid media is any type of media that is paid for.
- Owned media is media that a company own and has control of, for example, websites, blogs, and Facebook pages.
- Earned media, is media that is attributed back to the company without them paying for it, for example, word of mouth, or buzz. In other terms, anything that is created from the followers and that the company has not truly contributed to catalyzing.
All types of POE data need to be collected: Paid Offline data:
This includes spend or ratings, for example, GRPs. Here, another level of granularity could be added:
- What type of activity is it?
- What is the breakdown by creative/campaign used?
- What is the breakdown by spot length?
- What is the breakdown by the week or by film number?
- What is the breakdown by daypart?
All of this depends on the objectives that the team has agreed on with the client.
Paid Digital data: It refers to clicks, impressions, and spend. This could be divided into categories like the type of campaign, etc. Generally, the source of this data would be the media agency. It is possible at times to have the same agency handling both spend. Recently digital data has been made increasingly available thanks to the MMM specific data feeds that are abundantly provided by tech giants like Google and Facebook.
Owned media: These channels are controlled by the company, and they include the weekly unique visitors, the number of fans, etc. This type of media would be provided by the company since they usually own it.
With Earned media, the customer becomes the advocate of the brand. And they speak on its behalf. Data collected here is about online word of mouth, sentiment analysis, the volume of buzz that is being communicated, and whether it is positive or negative (several companies provide this type of analysis).
Conclusion
Recently, it has become safe to say that the abundance of data is guaranteed to any analyst at the beginning of their MMM project. This abundance, however, is not necessarily synonymous with quality. Therefore, it is crucial that the analyst always cross-checks their data to ensure its quality before ingesting it into the model. If there is one single piece of advice, I could provide here is that” Never assume data is correct”! In the next article, we will cover Data Exploration, the step where the analyst validates their data and considers the needed transformations which will turn their data into a story that makes sense from the business perspective.