Building DR Curves After Modeling Is a Mistake
In a Marketing Mix Modeling project, Diminishing Return curves are the outcome that allows the analyst to start understanding which marketing channels are worth their investment.
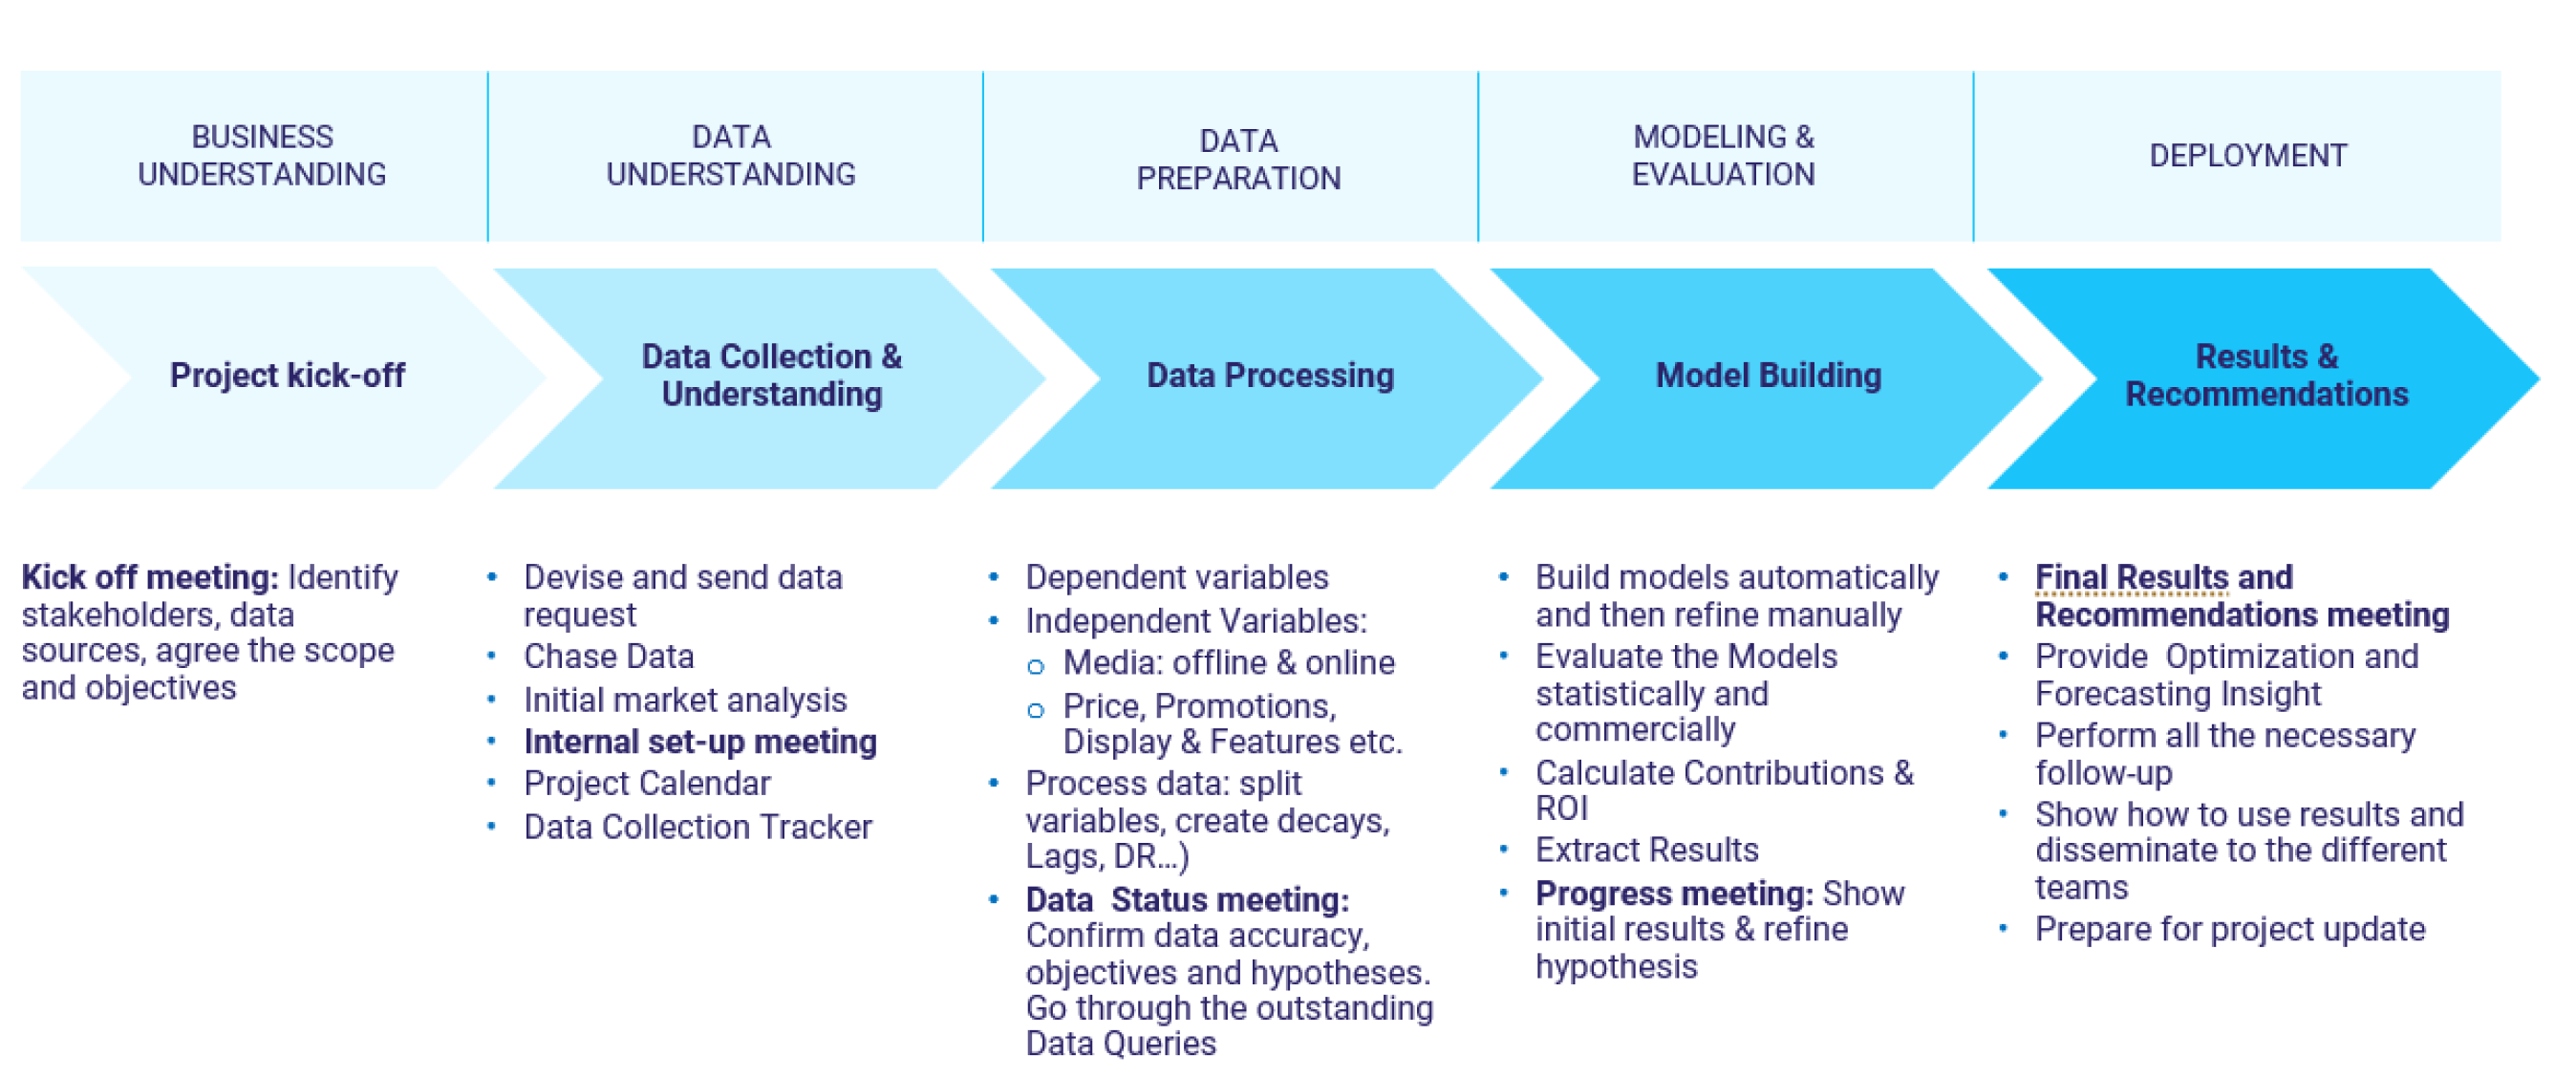
Creating these curves is part of Optimization, which is one of the last steps of the MMM workflow. As illustrated by the graph below.

What this graph shows accurately is that Modeling does start before Optimization. However, the relationship between the two steps is far from being a sequential one. The only way Optimization and Modeling are performed successfully is when they are performed iteratively. In that, creating Diminishing Return curves once Modeling is over is a mistake that will have serious consequences on the project’s outcomes. This article explains why the term “iterative” is the foundation of the relationship between Modeling and Optimization.
Diminishing Return Curves are Common Ground
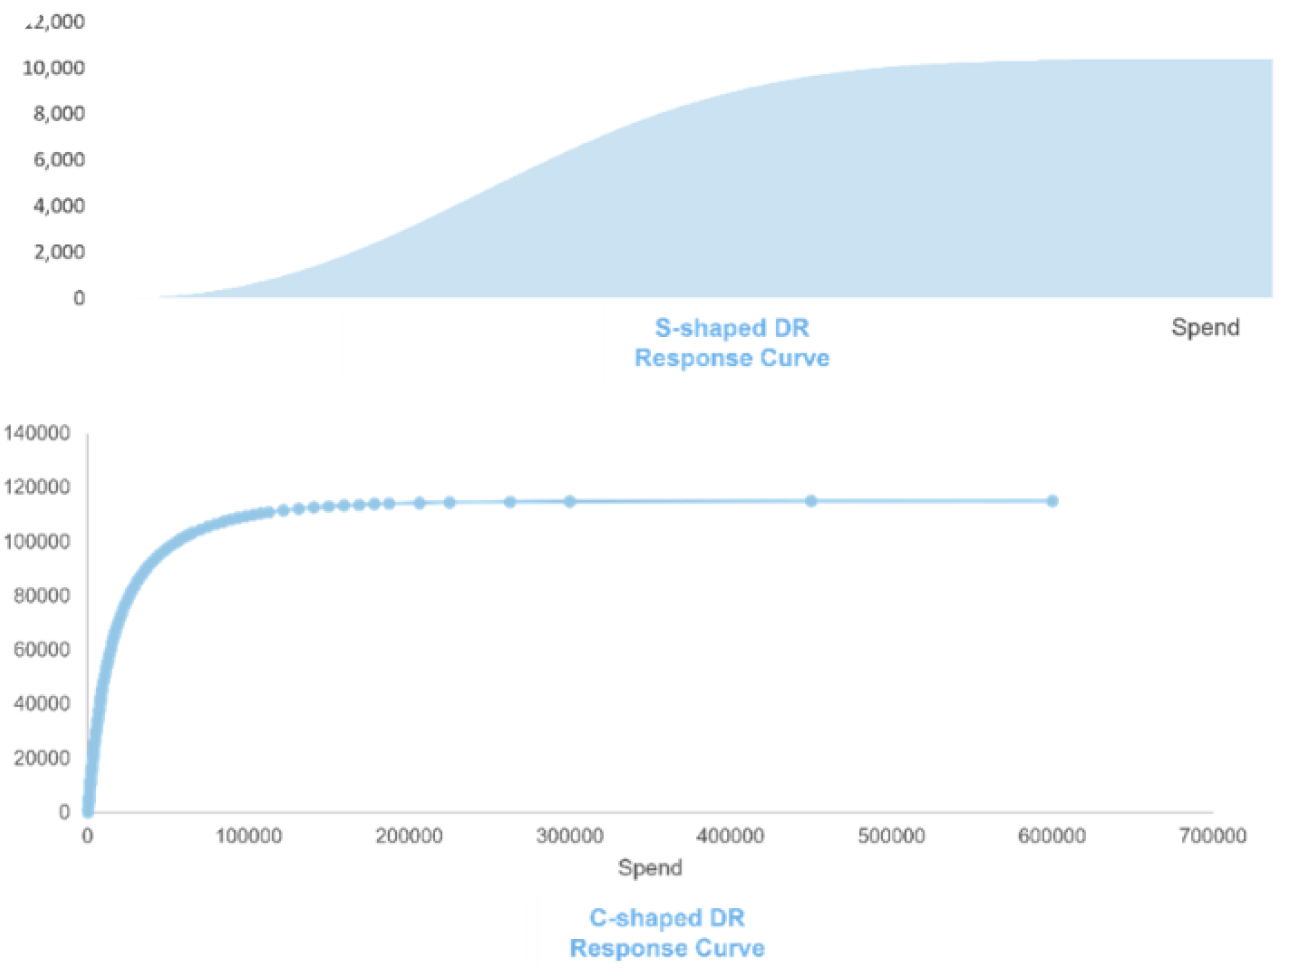
Before we discuss the relationship between Optimization and Modeling, let’s dive into the core of Optimization, which is DR curves. These curves are a visual representation of the following: The more you spend on a specific channel, the more revenue or contribution you get. However, your marginal returns will keep decreasing with every investment you make, until you reach the saturation point. This means that if you spend an additional dollar on that channel you will hardly get any incremental revenue.
The DR curves are created during modeling before they get ingested into Optimization. They are generally concave or S shaped, and as you approach complete saturation (as shown in graph 2), their slope becomes completely flat.

The Reason Behind the Iterative Nature
During the modeling phase, multiple curves are generated for the analyst to choose from and feed into their model. Here, the analyst should keep an eye on the shape of the curves that they are creating. They shouldn’t be highly saturated or not at all saturated. Once they decide what curves fit their data best –be it through a manual selection or an algorithm like genetic algorithms- they feed them into the Optimization in order to allocate the budget optimally.
In fact, the selected curve will exhibit a coefficient depicting the true impact of media on sales (i.e. while taking into consideration the channel saturation effect) and the other coefficients of the equation will be calibrated accordingly. Building a model where media variables don’t have DR built into them (i.e. linear impact) will yield different estimations of the coefficients and Diminishing Returns will not be correctly estimated. This rationale is the reason Optimization and Modeling should not be sequential and rather iterative as building DR curves should be part of the modeling process.
But What Happens if the Analyst Treats Optimization and Modeling as a Sequence?
As mentioned before, this could put the analyst in a situation where true coefficients, i.e. considering the DR effect, are not estimated correctly. Sticking to the linear coefficients will result in investing the entire budget to the channel presenting the highest coefficient and not allocating any money to the rest.
Note that some analysts tweak curves post-modeling and manually add the DR component. This is very dangerous as saturation in this case is not derived from data but based on the subjective judgment of the analyst.
From a realistic business perspective, this is unacceptable. Hence, while running their models, the analyst needs to create media variables presenting DR and regularly check the results of the Optimization following an agile approach.
⇒ The MMM project is finalized when both Modeling and Optimization make sense and depict true consumer behavior
Conclusion
Optimizations is one of the layers of MMM that provide insights and recommendations for the client, and because it is built on the Model, it is safe to say that the more robust is your model, the more you will be capable of providing sound and robust results and recommendation to your clients. The backbone of the Optimization exercise is the DR curves, which in turn are the result of applying the right transformations to the data to create different sensible curves to choose from for Optimization.


