

An updated MASS Analytics guide to measuring marketing effects at every level the business actually manages: region, store, and product category.
What this article covers
- → The nested structure marketing data actually has, and why flat models average it away
- → How hierarchical modeling reads region, store, and category effects in one framework
- → Partial pooling and Bayesian shrinkage, explained without the math
- → A structured comparison of complete pooling, no pooling, and partial pooling, with a verdict on when to use which
What Hierarchical Modeling Adds to Marketing Mix Modeling
Hierarchical modeling, also known as multilevel modeling, lets Marketing Mix Modeling (MMM) measure marketing effectiveness at several levels of a business at once, by region, store, and product category, while recognizing the relationships between those levels.
Most MMM programs do not work this way. Instead, they estimate one national coefficient per channel and hand the same answer to every region, every store, and every category. As a result, a campaign that performs well in urban regions and flops in rural ones reports as a single average that describes neither.
This is a refreshed and extended version of the guide we published in May 2025. The structure readers found most useful is intact. However, what is new is the estimation story: how partial pooling and Bayesian shrinkage make granular measurement reliable, and how the approach relates to the pooled regression methods we have written about for years.
A national average is not an insight. In fact, it is a compromise your budget pays for.
Marketing data is nested, and flat models ignore it
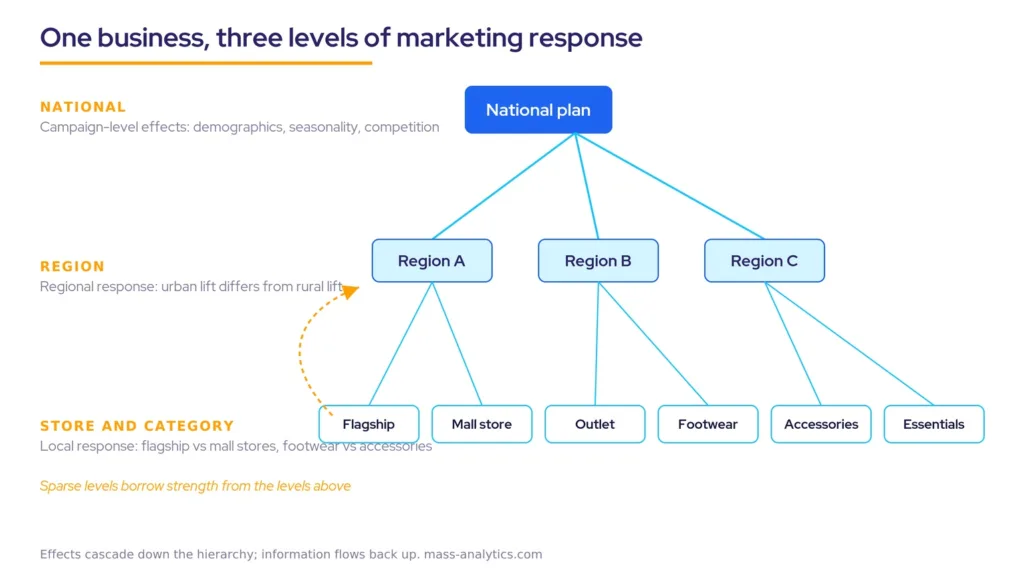
Real businesses are structured in layers. For example, regions contain stores, stores sell product categories, and categories contain SKUs. Similarly, marketing response follows the same structure, typically across three levels.
Region
Campaigns land differently across regions because demographics, competition, and seasonality differ.
Store
Likewise, within one region, stores respond differently depending on size, foot traffic, and local competition.
Category
Similarly, within one store, some product categories respond to a campaign far more than others.
A flat model treats every observation as interchangeable. A hierarchical model encodes the relationships instead: store performance sits inside regional conditions, categories inherit store-level effects while keeping their own response, and one campaign can carry both a broad national effect and a set of localized ones.
If you want the foundations before the granularity argument, our Comprehensive MMM Guide covers the full modeling workflow end to end.
What a single national coefficient hides
Take a clothing retailer launching a TV campaign. Yet a flat MMM returns one average impact for the whole business. In reality, the response splits three ways, and the example below, while illustrative, matches the pattern we see repeatedly in client work.
- The campaign performs strongly in urban regions and barely moves rural ones.
- Within urban regions, flagship stores respond harder than smaller outlets.
- Within a flagship store, footwear jumps while accessories stay flat.
Each of those splits is a budget decision. Which regions deserve more investment, which store formats justify local promotion, and which categories should anchor the next campaign are questions a national average cannot answer, because the average was built by erasing exactly the variation the decision needs.
This is also where hierarchical modeling earns its interpretability. Instead of thousands of disconnected coefficients, results arrive organized by the levels managers already think in: category readouts for trade teams, store readouts for retail operations, regional readouts for media planners.
Partial pooling is the engine that makes granularity reliable
Granular estimates raise an obvious objection: a single store or a small region rarely has enough data to support its own model. Historically, modelers picked between two imperfect answers.
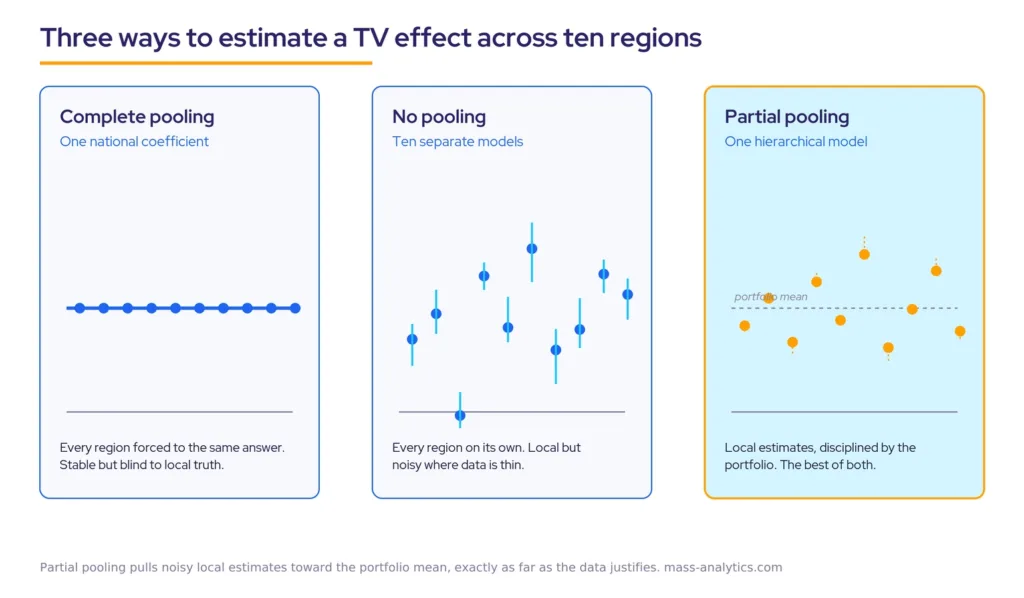
The first is complete pooling: stack every region into one panel and estimate a common response, the approach behind classic pooled regression in MMM. It is stable and data-efficient, and we have used it successfully to model different regions for years. However, its cost is the assumption that one coefficient fits all.
The second is no pooling: a separate model per region or store. Every unit gets a local answer, but where data is thin those answers chase noise, flip signs between refreshes, and fail validation.
Hierarchical models take the middle path, called partial pooling. Each store gets its own coefficient, but those coefficients are treated as draws from a shared group distribution. Where a store has rich data, its estimate stands mostly on its own evidence. Where data is sparse, the estimate is pulled toward the group mean. As a result, that pull is shrinkage, and its strength is set by the data itself: the noisier the local signal, the more the model relies on what the portfolio has learned.
Shrinkage is not a limitation of hierarchical models. Rather, it is the discipline that keeps store-level estimates honest.
This is why hierarchical MMM is usually estimated in a Bayesian framework. Priors at each level of the hierarchy encode how much regions can plausibly differ, the posterior updates those priors with the data, and every coefficient ships with a credible interval instead of a bare point estimate. In fact, Google’s research team documented the same effect for geo-level media mix models: hierarchical estimation at the geo level produced tighter credible intervals than modeling national data alone.
One distinction is worth keeping sharp, because the industry blurs it constantly. Hierarchical describes the model structure: coefficients vary by group and share a distribution. Bayesian describes the estimation: priors updated by data. In short, they are separate choices. Indeed, frequentist mixed-effects models fit the same hierarchical structure and shrink estimates the same way. Hierarchical Bayesian MMM is the combination of the two, and the combination is popular because Bayesian machinery handles multilevel structures naturally, not because hierarchy requires it.
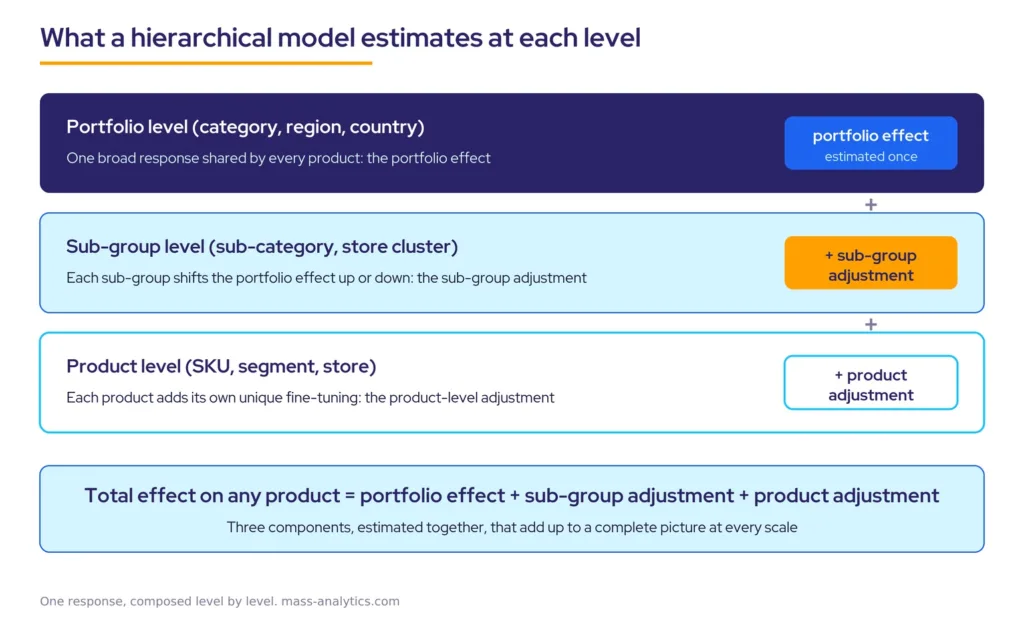
None of this abandons regression. As we argued in Regression is not stuck in 1995, the hierarchical layer is an upgrade to the estimation engine, not a replacement for it.
Choosing between the three approaches
| Complete pooling | No pooling | Partial pooling (hierarchical) | |
|---|---|---|---|
| What it estimates | One coefficient shared by all units | An independent coefficient per unit | A coefficient per unit, drawn from a shared group distribution |
| Local accuracy | None; every unit gets the average | High where data is rich | High where data is rich, disciplined where it is thin |
| Stability on sparse data | High | Low; estimates chase noise | High; shrinkage pulls sparse units toward the group mean |
| Main risk | Averages away real variation | Overfits; unstable between refreshes | Needs a correctly specified hierarchy |
| Verdict | Choose when units genuinely behave alike | Choose only when every unit has deep data | Choose when levels differ and data depth varies, which is most multi-region MMM |
The payoff shows up in measured uplift
Structure pays. Hierarchical modeling is one member of a family of structure-aware specifications, and the published evidence for that family is strong. In a MASS Analytics engagement, nested modeling uncovered a 12% sales uplift that a flat specification would have averaged away. For instance, nested models capture a different kind of structure, the interactions between channels, such as TV driving search, but the lesson carries over directly: model the business the way it is actually built, and effects a flat model hides become measurable.
Hierarchical structure adds its own version of that payoff: halo effects, where advertising for one category lifts a neighboring one. For example, a TV ad for salty snacks raises beverage sales; a sneaker campaign moves socks. Because a hierarchical model represents categories within stores explicitly, it can include cross-category terms that credit the spillover to the campaign that caused it. Model each category in isolation and that lift is either missed or wrongly booked as baseline.
The question is not whether marketing effects vary by region, store, and category. They do. The question is whether your model can see it.
How MassTer applies hierarchical modeling
We built MassTer, our MMM platform, to handle hierarchical structures as a first-class feature rather than a custom build.
Automated segmentation
Regions, stores, and categories are assigned from predefined structures, which removes the manual data-shaping step where hierarchy errors usually enter.
Variable slopes at every level
Channel effects can differ by category and by product, with random intercepts and slopes capturing the variation a fixed coefficient would flatten.
Explicit halo measurement
Cross-category effects are modeled directly, so a snack campaign’s lift on beverages is credited to the campaign rather than lost in baseline.
Layered reporting
Results read out at category, subcategory, and product level, matching how budget owners actually make decisions.
Four practices that keep hierarchical models honest
Define the hierarchy before you model
Write down the natural layers of the business and check that the data supports each one. A structure like region, then store format, then category works only if there are enough observations at every level to estimate something. Then, start broad and add depth only when a layer improves the model.
Balance granularity against stability
More levels are not automatically better. If store-level data is too sparse even for partial pooling to help, group stores into meaningful clusters such as large urban versus small rural. Then test whether each added layer improves prediction, using the same standards we set out in the three layers of MMM validation. If a layer adds parameters without adding accuracy, remove it.
Model halo effects explicitly
Include cross-category terms where the business logic supports them, and test for spillover between related products. In other words, assuming independence between categories that shoppers buy together is a specification error, not a simplification.
Report layer by layer
Lead with the headline effect, then break it down: overall lift first, then the regional split, then store formats, then categories. Executives, media buyers, and store managers each act at a different level, and a hierarchical model is the only kind that can hand each of them a number that is actually theirs.
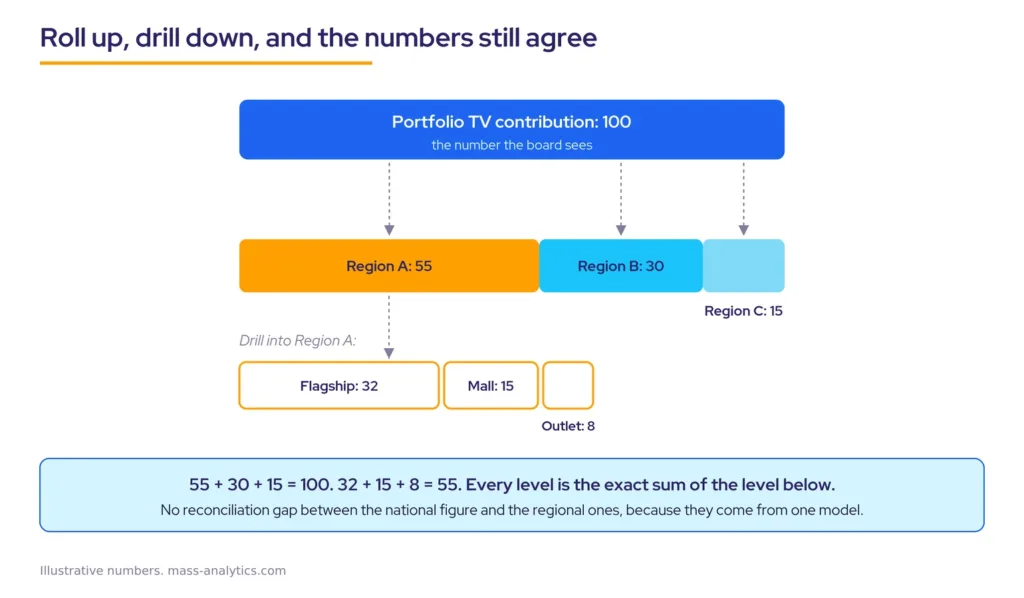
This layered readout carries a property flat models cannot offer: consistency. Every level is the exact sum of the level below it, so the national figure and the regional figures never need reconciling. When the board number and the regional numbers come from one model, the pointed question in the room, which products, which regions, where exactly is this working, has an answer at every level from the same evidence base.
Frequently asked questions
Hierarchical modeling, also called multilevel modeling, is an MMM approach that estimates marketing effects at several levels of a business at once, such as region, store, and product category, while linking the levels statistically. Each unit gets its own estimate, and the levels share information, so results reflect local differences without treating every unit as independent.
Pooled regression stacks all regions or products into one panel and estimates a common response, so every unit shares one coefficient. Hierarchical modeling relaxes that assumption: coefficients vary by unit but are drawn from a shared distribution. Pooled regression is a special case of full pooling; hierarchical modeling sits between full pooling and fully separate models.
Partial pooling is the mechanism that lets hierarchical models estimate units with thin data. Each unit’s coefficient is pulled toward the group average, and the pull is proportional to how noisy the local data is. Units with rich data keep estimates close to their own evidence, while sparse units borrow strength from the rest of the portfolio.
Bayesian estimation fits the hierarchical structure naturally. Priors at each level state how much units can plausibly differ, the data updates those priors, and shrinkage follows automatically. It also produces credible intervals for every coefficient at every level, which tells decision makers how much confidence a store-level or category-level number deserves.
No. Hierarchical modeling is a model structure: coefficients vary by group, such as region or category, and are drawn from a shared distribution. Bayesian modeling is an estimation approach: priors updated by data into posteriors. A hierarchical model can be estimated with frequentist mixed-effects methods, and a Bayesian model can be completely flat. Hierarchical Bayesian MMM combines the two, and the pairing is common because Bayesian estimation handles multilevel structures naturally.
As many as the business manages budgets at, and no more than the data supports. A useful test has three parts: the business makes decisions at that level, there are enough observations at that level to estimate an effect, and adding the level improves predictive accuracy. If a proposed layer fails any of the three, leave it out or replace it with clusters.
Yes. Because the model represents categories within stores explicitly, it can include cross-category terms that capture spillover, such as a snack campaign lifting beverage sales. Modeling categories in isolation either misses that lift or wrongly assigns it to baseline, which understates the true return of the campaign that caused it.
Measure at the level where money moves
Hierarchical modeling aligns MMM with the way businesses are actually built: nested, uneven, and locally different. In doing so, it captures the relationships between levels, keeps sparse segments stable through partial pooling, and turns one model into a set of answers each budget owner can act on.
Marketing budgets are not set nationally. Instead, they are set region by region, store format by store format, category by category. The next planning round will ask for numbers at exactly those levels. Will your model have them, or will it have one average?
To see hierarchical modeling running on your own data structure, book a MassTer demo.
Key takeaways
- ✓ A flat MMM reports one effect per channel; hierarchical modeling reports the effect at every level the business manages: region, store, and category.
- ✓ Partial pooling lets sparse segments borrow strength from the portfolio, so granular estimates stay stable instead of chasing noise.
- ✓ Bayesian shrinkage is the discipline behind that stability: local estimates move toward the group mean exactly as far as the evidence justifies.
- ✓ In a published MASS Analytics case, nested modeling uncovered a 12% sales uplift that a flat specification would have averaged away.
- ✓ Add hierarchy levels only where the business decides budgets, the data supports estimation, and prediction measurably improves.