

Dr. Ramla Jarrar of MASS Analytics on MMM validation: why statistical fit is the floor, not the finish, and where causal proof begins.
- →Why a model passes every statistical test and still be wrong about the market
- →The four commercial questions every contribution has to answer before a debrief
- →Where observation runs out and experimental proof begins
- →How the three layers compound into a measurement program a CFO cannot dismiss
A Marketing Mix Model can pass every statistical test on the sheet and still be wrong about the market. I have watched it happen. The residuals behave, the t-statistics clear their thresholds, the R squared looks excellent, and the model quietly hands a client a contribution figure that no experienced marketer would sign off on.
For a decade, marketing measurement ran on trust, because the alternative was no measurement at all. Models with opaque construction and unwritten assumptions defended budgets worth millions, sometimes billions. That is changing, and I welcome it. Open validation frameworks are in the conversation. Accuracy is measured against published thresholds rather than asserted. Stability is tested rather than assumed.
But validation is a wider discipline than fit testing. The question is not only whether the model fits the data. It is whether the model holds under commercial scrutiny, and whether its claims about cause survive a test that no observational method can run on its own.
At MASS Analytics we think about validation in three concentric layers: statistical validation, commercial validation, and causal proof through experimentation. The first is necessary. The second separates a model that fits from a model that holds. The third is the standard that closes the CFO conversation rather than extending it.
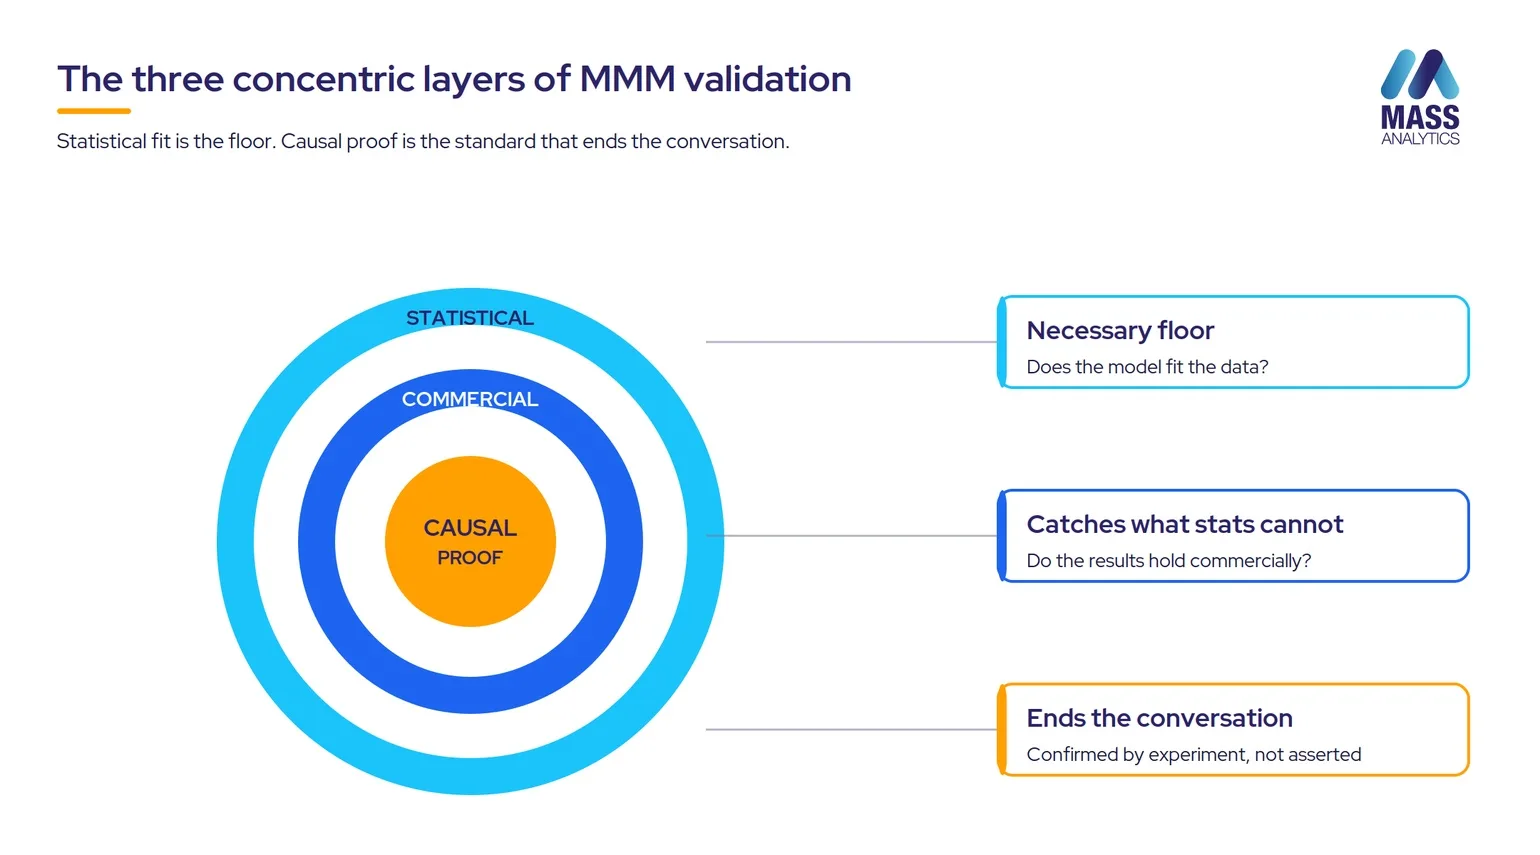
A model can pass every statistical diagnostic and still assign negative contributions to a channel that carries 20% of the media budget. That is a commercial failure, not a statistical one.
Statistical validation is the floor, not the finish
Statistical validation tests the diagnostic properties of the estimated model. We assess a battery of eight diagnostics, and the aim is for all eight to clear their thresholds. When one does not, that is not automatically fatal, but we have to understand and document the reason rather than wave it through. A diagnostic that fails without explanation is a warning, not a rounding error.
- R squared measures how much of the observed variation the model explains. For weekly national sales models I expect it above 0.85.
- Adjusted R squared penalizes unnecessary complexity, so a model cannot look better simply by adding variables.
- MAPE measures average forecast error as a percentage of actual values. The standard is below 10% for stable categories and below 15% for volatile ones.
- The F-statistic tests whether the full variable set is jointly significant.
- T-statistics test variable-level significance. Below an absolute value of 2, the confidence interval is wide enough that the true effect could plausibly be zero.
- Durbin-Watson detects autocorrelation in the residuals, the signal that the model is missing structure the data contains.
- VIF detects multicollinearity, where variables move so closely together that the model cannot separate their effects.
- Normality tests confirm the model is not systematically over-predicting or under-predicting in particular conditions.
In-sample diagnostics are not enough on their own. Rolling cross-validation extends the test forward in time. We build the model on an initial window, use it to forecast the following period, then re-estimate it on an expanded window and test it on the next unseen block. A model whose accuracy falls away as the window advances into more recent data has a structure that no longer matches current market conditions.
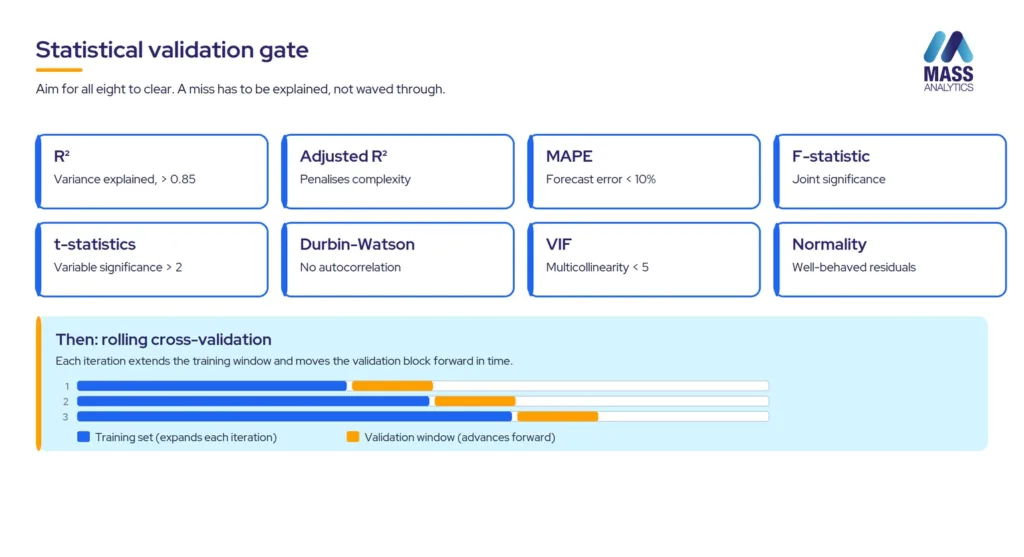
Eight diagnostics form the floor of MMM validation. Aim for all eight to clear. A diagnostic that misses can be lived with, but only when the reason is understood and documented, not waved through.
Statistical validation establishes internal consistency. It confirms that the model reproduces its data, that its variables are significant, that its residuals behave, and that its accuracy holds forward on unseen data within the same window. These are necessary conditions. They are not sufficient. A statistically perfect model might assign negative contribution to a channel that takes a fifth of the media budget. A model with clean t-statistics might estimate a positive price effect in a category where rising prices reliably suppress demand. A model with textbook Durbin-Watson properties might hand 40% of contribution to a channel that is 5% of budget, with no structural explanation. None of these is a statistical failure. Each is a commercial plausibility failure, and they are not edge cases.
Commercial validation is the discipline statistics cannot administer
Commercial validation is the test that decides whether the model produces a decision. It asks four questions of every candidate model before that model reaches the debrief table.
The four commercial validation questions
- Directional consistency. Are all media contributions in the expected direction? A negative contribution for incremental spend needs an explicit causal mechanism, not statistical acceptance.
- Magnitude plausibility. Are contribution sizes consistent with known spend levels? A channel at 5% of budget should not carry 40% of incremental sales without a structural reason you can explain and verify.
- Non-media driver behavior. Do price, distribution, and competitive variables behave as expected? A positive price contribution in a price-sensitive category is a red flag to investigate before the model proceeds, even when every statistical test passes.
- Cross-variable coherence. Are contributions consistent across correlated drivers? When a brand runs TV and digital together, the split should reflect media planning logic, not the artifacts of multicollinearity.
A channel that is 5% of budget should not drive 40% of incremental sales unless there is a structural reason you can explain and verify.
Behind those four questions sits a wider discipline: triangulation against external evidence. Six independent sources are available in practice to check model outputs against reality. No single source is conclusive. Convergence across several is the goal.
- Lift studies and randomized controlled trials
- Multi-touch attribution outputs
- Custom market research and brand tracking
- Industry benchmarks and syndicated norms
- Stakeholder expectations from planning, brand, and sales
- Prior MMM results from earlier model generations
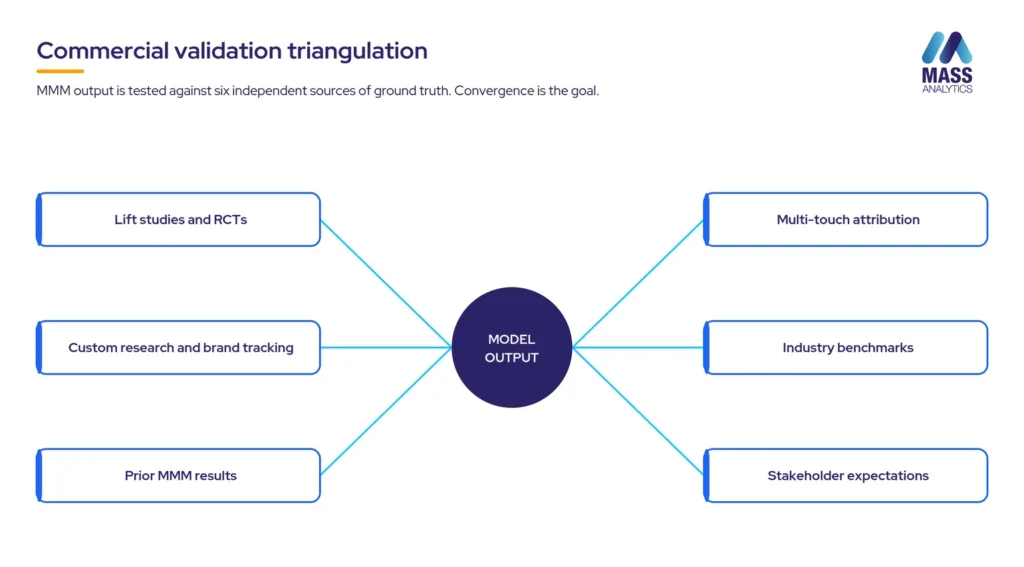
Statistical validation establishes internal consistency. Commercial validation, triangulated against external evidence, establishes that the model is consistent with the market it claims to describe. A model that has passed both is far harder to dismiss than one that has passed only the first.
Statistical validation tells you the model fits. Commercial validation tells you it holds. Only experimentation tells you it is true.
Causal proof is where the CFO conversation ends
Statistical validation establishes internal consistency. Commercial validation establishes consistency with the market. Neither produces causal proof.
Both are observational at their foundation. They find patterns in historical data and test those patterns against thresholds and expectations. Neither can rule out that an estimated channel contribution is capturing demand that would have arrived regardless of the media investment.
Experimental calibration can. A randomized controlled trial, run at geographic scale across a representative population, holds everything constant except the channel being tested. The difference in outcomes between randomly assigned treatment and control groups, after normalizing for baseline differences, is the causal estimate of that channel’s incremental effect. It is the strongest evidence available short of a live forecasting test.
The Models Plus Experiments (MPE) framework
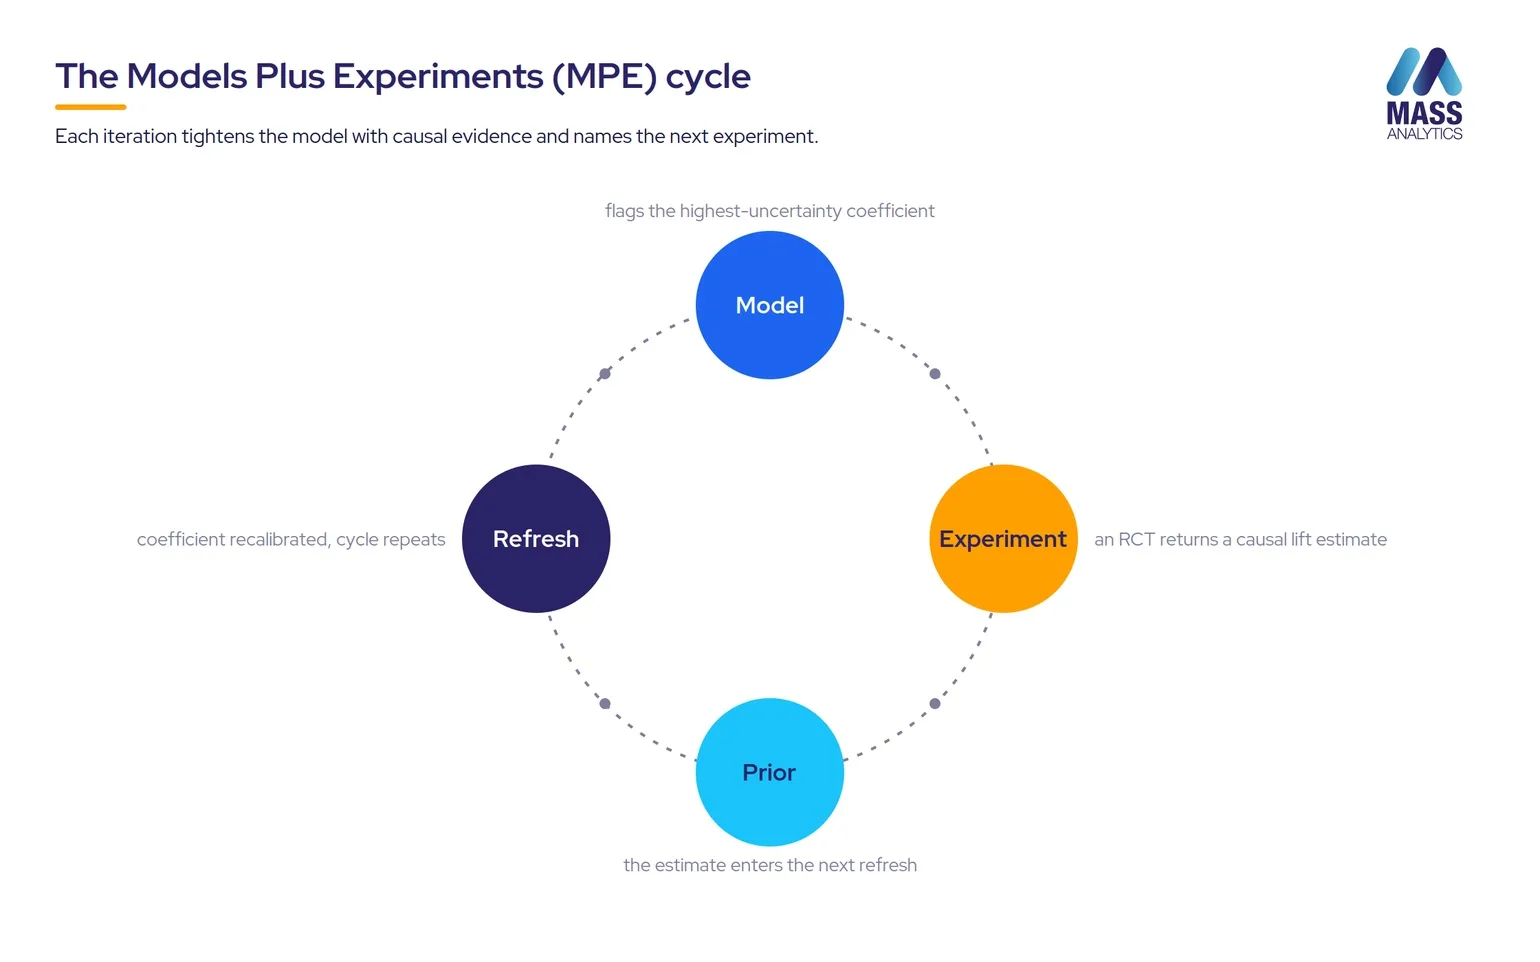
We developed the Models Plus Experiments (MPE) framework jointly with Central Control, Inc. It pairs our modeling capability with Central Control’s methodology for large-scale geographic randomized trials, and it treats experimentation as a continuous cycle rather than a one-off check. The model identifies the coefficients that carry the most uncertainty and the most commercial consequence. Those become experiment candidates. The experiment returns a causal lift estimate with pre-specified confidence intervals. That estimate enters the next model refresh as a Bayesian prior, recalibrating the coefficient. The improved model then points to the next experiment.
Why this layer changes the boardroom conversation
There is a version of a channel’s ROI that rests entirely on a regression coefficient estimated from observational data. And there is a version of the same ROI confirmed by a randomized trial run at geographic scale, at 95% confidence. These are not the same evidence. Anyone with a different model specification can challenge the first. The second cannot.
A regression coefficient can be challenged by anyone with a different model specification. A lift confirmed by a randomized geographic trial cannot.
When the CFO questions the media budget, when the agency challenges the contribution split, when the board asks whether marketing is driving growth or merely correlating with it, the experimentally calibrated model answers in a way the purely observational model cannot. This is why we partnered with Central Control. Models deliver coverage and continuity. Experiments deliver causality and calibration. Together they are the standard that ends the measurement conversation rather than extending it.
Validation compounds when you treat it as a practice
Validation is not a test run once at the close of a model build. It is a discipline that runs alongside the modeling program, and its commercial return compounds. A model that has passed structured statistical validation, been triangulated against external sources, and had its highest-consequence coefficients calibrated through experiment holds its predictive validity across refresh cycles rather than degrading between them. Run continuously, validation stops being a milestone and becomes an operating model. We recalibrate the model as new data arrives, monitor its diagnostics on the same cadence, and flag a model that no longer fits the data it has been refreshed against before it informs a plan. A refreshed model that has quietly stopped fitting is not current. It is producing the wrong answer faster.
The principle is straightforward: the same coefficient stability that explains the past predicts the future under the same conditions. Explanation and prediction are not separate capabilities from different model properties. They are both expressions of the same coefficient stability, and they stand or fall together.
The benefit accumulates. An organization that has run one experiment has confirmed one coefficient at one point in time. An organization that has run 50 experiments across its media portfolio over five years has built a causal evidence base no competitor can easily replicate. Each test adds to the prior distribution for the next, reducing the sample size needed to detect a given effect, narrowing credible intervals, and improving the precision of every optimization that follows.
What a complete validation program looks like
For a CMO or analytics lead assessing a partner’s validation discipline, the following questions filter the field. They do not ask whether a vendor can run statistical diagnostics, because every credible provider can. They ask whether the program runs across all three layers, and whether the team documents the evidence in a form a CFO can interrogate.
Six questions to ask any MMM partner
- Does the validation battery cover all eight diagnostics, or only a subset? R squared, adjusted R squared, MAPE, F-statistic, t-statistics, Durbin-Watson, VIF, and normality tests are the complete set. Anything fewer tests a subset of fit.
- Is rolling cross-validation built into the workflow? A single hold-out split is informative. Rolling cross-validation across expanding windows tests whether the model generalizes to current conditions or only to the training period.
- How are commercial plausibility failures detected and resolved before the debrief? A structured review applied before any client interaction is what separates a vendor that catches the pharmaceutical cannibalization at the model stage from one that surfaces it at the debrief table.
- Against how many external ground-truth sources are outputs triangulated? Six are available, and at least two should agree before a contribution is treated as settled. Reliance on any single source is fragile.
- Where experimental evidence exists, is it used as a structured Bayesian prior or only as a sanity check? A vendor that runs trials and then leaves the result outside the modeling workflow has not closed the calibration loop.
- Is the full validation history audit-traceable? Every model run logged with its specification, every diagnostic with its result, every prior with its source, every coefficient update with its before and after. Validation is documentation as much as it is testing.
A program that answers all six produces outputs that can be defended at any level: to the agency that challenges the channel contributions, to the CFO who questions the ROI, and to the board that will stake next year’s budget on the recommendation.
The standard that ends the conversation
The validation discussion happening across the industry is welcome. The move from opaque, unaudited delivery to transparent, reproducible testing is overdue, and we support it. Our own discipline contributes to it.
But the discipline that produces models a CFO will defend, a board will fund, and a planning team will act on is wider than statistical diagnostics. It runs through commercial plausibility review, triangulation against six independent sources, and, where the channel is large or contested, causal calibration through randomized experiments whose design was documented before the data was collected. So here is the question worth taking into your next budget meeting. Not whether your model passes statistical validation, because every model worth deploying does. Whether the validation program behind it operates at all three layers, and whether the result is a model that survives the scrutiny that decides whether the budget actually moves.
The right question for a CMO in 2026 is not whether the model passes statistical validation. It is whether the validation behind it operates at all three layers.
Frequently asked questions about MMM validation
MMM validation is the discipline that tests whether a Marketing Mix Model can be trusted to inform real budget decisions. It runs across three layers: statistical validation (does the model fit the data?), commercial validation (do the results make business sense?), and causal proof (have the model’s claims been confirmed by experiment?). A complete program runs all three continuously, not as a one-off check at the end of a build.
No. A model can pass every statistical diagnostic, an R squared above 0.85, t-statistics above 2, clean residuals, and still produce contribution figures that contradict basic market reality. Statistical validation establishes internal consistency. It does not establish that the model is telling the truth about the market. Commercial validation and causal proof close that gap.
A commercially valid MMM clears four tests: every channel’s contribution moves in the expected direction, the size of each contribution is plausible given known spend, non-media drivers like price and distribution behave as the market dictates, and contributions across correlated channels are coherent with media planning logic. The outputs should also triangulate against at least two of the six independent ground-truth sources, so no single method carries the result on its own.
Causal proof is the evidence a randomized controlled trial produces. Unlike observational methods, an RCT holds everything constant except the channel being tested and measures the difference in outcomes between randomly assigned treatment and control groups. The resulting lift estimate can be used as a Bayesian prior in the next model refresh, recalibrating the coefficient with experimental evidence. At MASS Analytics this runs through the Models Plus Experiments (MPE) framework, developed jointly with Central Control, Inc.
Validation is not a one-off exercise. Statistical diagnostics should be re-run on every refresh. Commercial plausibility should be reviewed on every model output, before any client interaction. Causal experiments should run continuously on the highest-uncertainty, highest-consequence coefficients, with each result feeding the next refresh as a Bayesian prior. A program run this way holds its forecast accuracy across refreshes instead of degrading between them.
MPE is the continuous-learning framework MASS Analytics developed jointly with Central Control, Inc. It treats experimentation as an operating system rather than a one-off validation exercise. The model identifies which coefficients carry the greatest uncertainty and commercial consequence, an experiment is designed to test that coefficient, the result becomes a Bayesian prior in the next refresh, and the improved model identifies the next experiment. Each iteration tightens the model’s coefficients with causal evidence.
- ✓A Marketing Mix Model can clear every statistical test and still be commercially wrong. Statistical fit is the floor of validation, not the finish.
- ✓Commercial validation asks four questions of every contribution and triangulates the answers against six independent sources. It catches what statistics cannot see.
- ✓Only a randomized experiment produces causal proof. A coefficient confirmed by a randomized geographic trial survives scrutiny that a regression coefficient alone does not.
- ✓Validation compounds. A program that runs all three layers continuously holds its accuracy across refreshes and builds a causal evidence base competitors cannot easily replicate.