
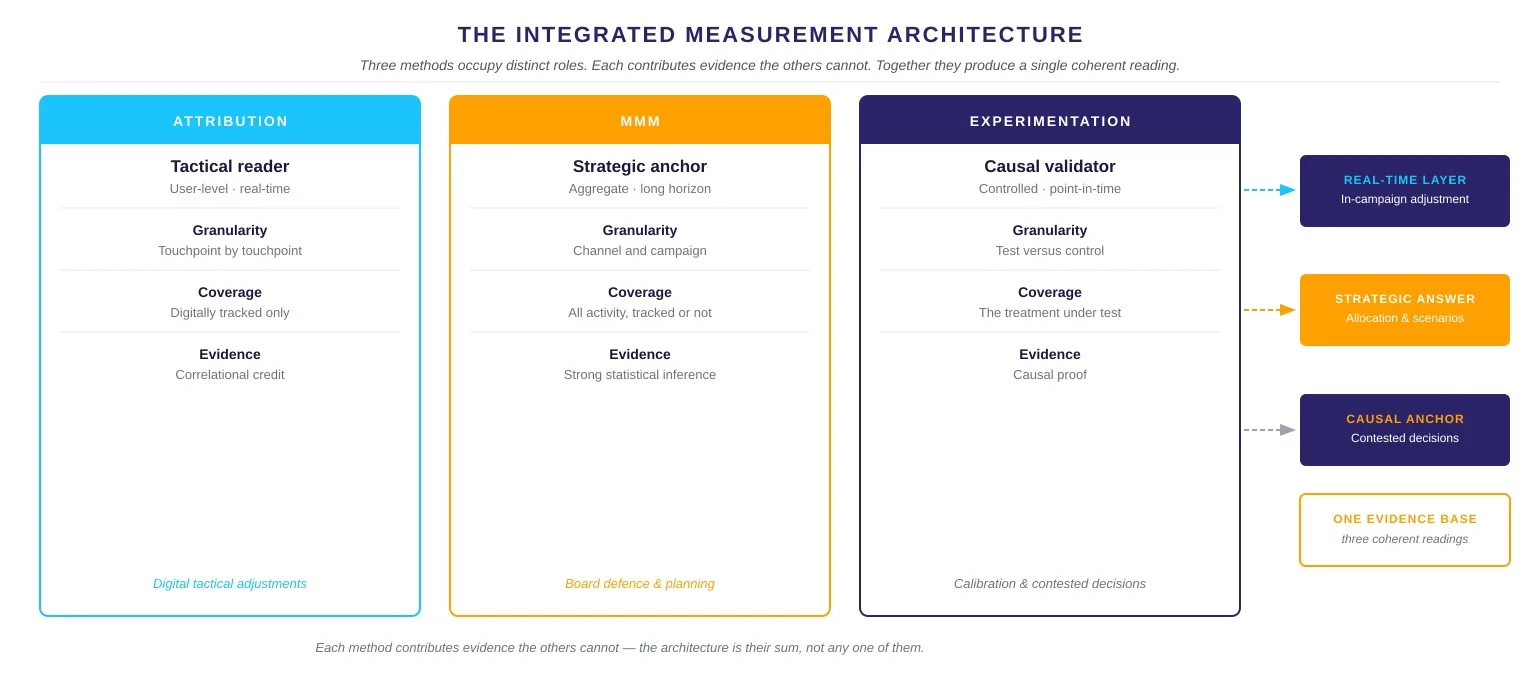
- →How MMM and incrementality testing function as complementary layers, each doing a distinct job
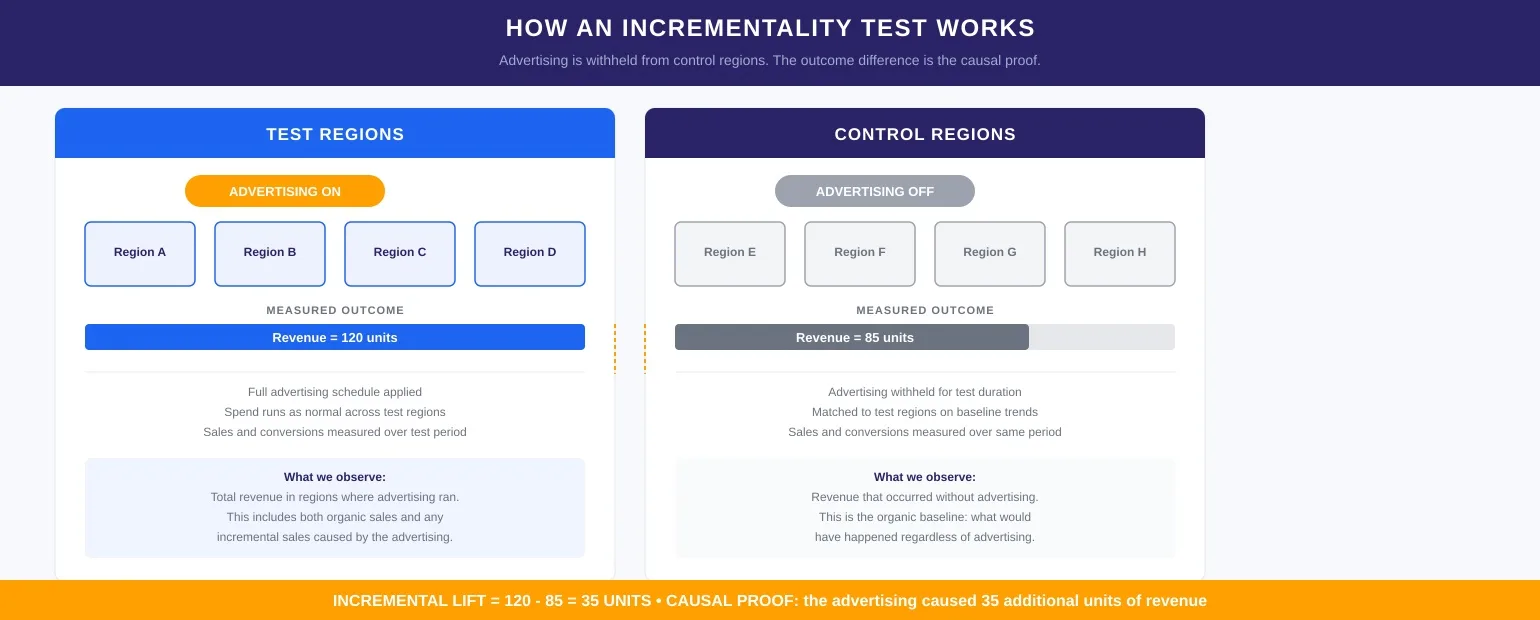
- →How geo-based randomized controlled trials work as the standard incrementality test design
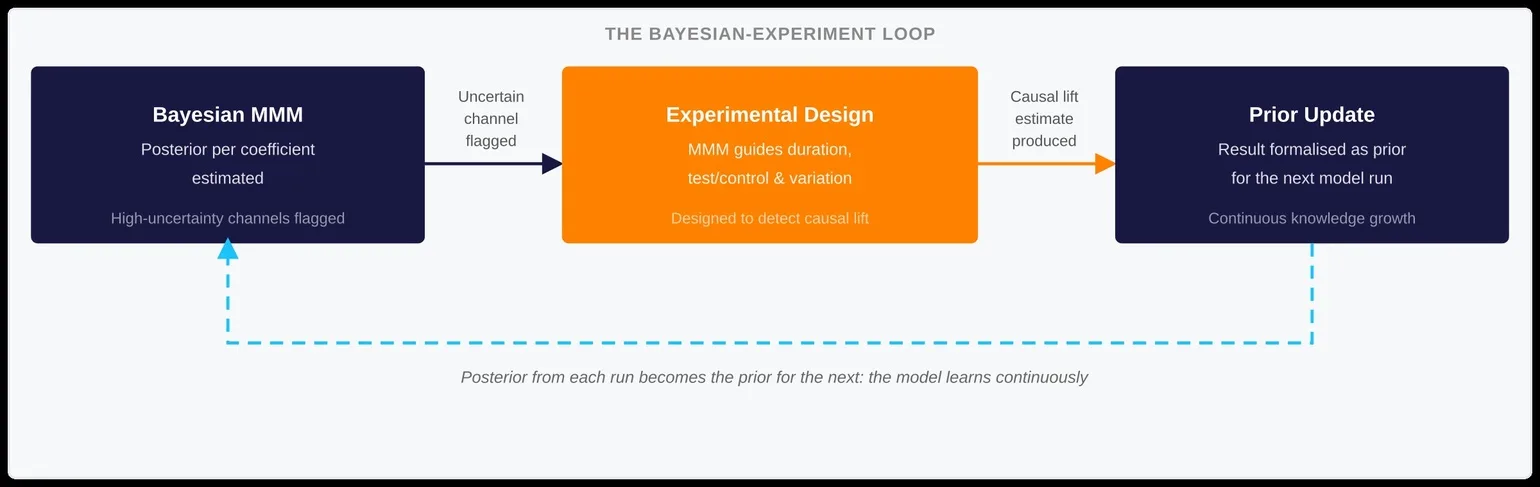
- →The Bayesian calibration loop that feeds experimental results back into the model
- →Why MMM should guide experimental design, not the other way round
- →How to treat divergence between experiments and MMM as a signal, not a failure
MMM is, for most organizations, the most complete picture of marketing performance they have. It reads the full media mix — including channels that attribution cannot see. Furthermore, it separates media effects from pricing, seasonality, and competitive activity, providing strategic answers at the scale a CFO can act on.
For over two decades, MMM has been the measurement method that serious marketing organizations build their planning around.
However, there is one question MMM does not settle on its own: causation. The model produces strong statistical inference — it tells you what correlated with your sales outcome. That correlation is not the same as proving the channel caused the outcome.
In most business decisions, that distinction does not matter. But in genuinely contested decisions — where budget is large, stakeholder skepticism is high, and someone in the room demands proof — it matters enormously.
Why Causation Changes Everything
Incrementality testing is what produces that proof. Not as a replacement for MMM, but as a precision layer on top of it. And it is only useful when MMM is doing its job first.
I have spent twenty years watching brands make expensive decisions on the wrong read of their data. The pattern is consistent: a channel looks high-ROI in the model, gets more budget, and the business grows. Everyone assumes the channel is working. Then someone cuts it in a downturn and nothing changes — or someone defends it in a board meeting and a skeptical CFO asks for causal proof, and the room goes quiet.
Incrementality testing is what ends that silence. Here is how the methodology actually works.
The Measurement Gap That Matters
An MMM that estimates a channel’s contribution at 8% produces a number with a confidence interval. In contrast, an experiment that withholds the channel in matched markets and observes a 7.4% revenue decline produces a number with causal certainty. When MMM is challenged by a skeptical CFO, an experimental result is what closes the conversation.
What Incrementality Testing Actually Measures
Incrementality is a simple concept. Specifically, it asks: how much of this revenue would have happened without our advertising? Rather than identifying which channels look like they are performing, or which platform reports the highest ROAS, it asks what our marketing actually, causally produced.
The incrementality test answers that question through a controlled experiment. It withholds the advertising treatment from one group, applies it to another, and measures the difference in outcome. That difference is the incremental effect. Essentially, the channel either caused additional revenue or it did not.
This is fundamentally different from what attribution models and MMM produce. Attribution assigns credit across the digital touchpoints it can observe, while MMM uses statistical inference to separate the contribution of each factor from historical data. Both are powerful. However, neither is a controlled experiment.
Incrementality testing is therefore the only method that establishes whether a causal relationship exists — not just whether a correlational one does.
The distinction has real teeth. A channel can look high-ROI in your MMM and still be capturing sales that would have happened regardless. Conversely, it can look low-ROI and be driving significant incremental revenue through a pathway the model cannot fully see. MMM gives you a very strong read; incrementality testing tells you whether that read holds up under causal scrutiny.
MMM tells you what correlated with your sales outcome. Incrementality testing tells you what caused it. The gap between those two statements is where the most expensive decisions get made.
How MMM and Incrementality Testing Compound Each Other
MMM and incrementality testing are not alternatives. Rather, they cover different blind spots and make each other more valuable when combined.
Why MMM Coefficients Need Experimental Grounding
MMM coefficients carry uncertainty. When a channel has little variation in spend over the modelling period, the model struggles to isolate its contribution precisely. As a result, the coefficient is statistically weak — you have a range of plausible estimates rather than a precise number. This is not a flaw in the methodology; it is an honest reflection of what the data can support.
Incrementality testing fills exactly that gap. Where the model has a wide, uncertain coefficient, you run an experiment. The experiment provides a causal lift estimate for that channel under controlled conditions. That estimate is then used to calibrate the model: the uncertain coefficient is anchored to observed causal evidence rather than left floating in statistical inference.
How Each Method Strengthens the Other
The relationship works in both directions. MMM guides better experiment design — it tells you how many weeks a test needs to run for a given channel, which regions provide the best test-control match, and what level of spend variation gives the experiment its best chance of yielding a usable estimate. Moreover, MMM anchors the experiment in commercial reality. The experiment, in turn, provides causal proof that strengthens the model. Together they compound.
How Geo-Based Randomized Controlled Trials Work in Practice
The standard implementation for incrementality testing in MMM calibration is the geographic randomized controlled trial. Specifically, it uses designated market areas (or equivalent geographic units) as the experimental unit. Some regions receive the advertising treatment; others do not. The difference in commercial outcomes between groups — after normalizing for baseline differences — is the estimated incremental effect.
Notably, the method is privacy-safe, omnichannel, and fully auditable. It requires no individual-level tracking and no vendor compliance beyond standard geo-targeting capability.
Scale matters critically. In the United States, all 210 nationally defined DMAs should be included wherever possible. More units mean greater statistical power and more precise lift estimates. The temptation to run small, fast experiments on a handful of markets produces estimates too uncertain to be trusted as calibration inputs.
The $1.5 billion branded search case we have written about elsewhere demonstrates precisely what is at stake when the methodology is applied at full scale. In that case, a channel flagged for cuts was generating revenue an order of magnitude larger than attribution had measured, through conversion paths that never appeared in the digital funnel.
Before running an experiment, ask MMM three questions: How many weeks does it need to run to produce a reliable signal? What split between test and control markets gives enough statistical power? What range of spend variation will produce a measurable lift? Without those inputs, experiments are often too short, too small, and too uncertain to be usable.
The Calibration Loop: How Experimental Results Enter the Model
The output of a geo-experiment is not a final verdict. Rather, it is structured causal evidence with a known confidence interval. The way that evidence enters the model is through Bayesian updating.
The experimental lift estimate and its standard error serve as the prior. The model’s likelihood from the observed historical data provides the updating step. As a result, the posterior is the calibrated coefficient that enters the next model run — reflecting both the observational evidence from the data and the causal evidence from the experiment, weighted by the precision of each.
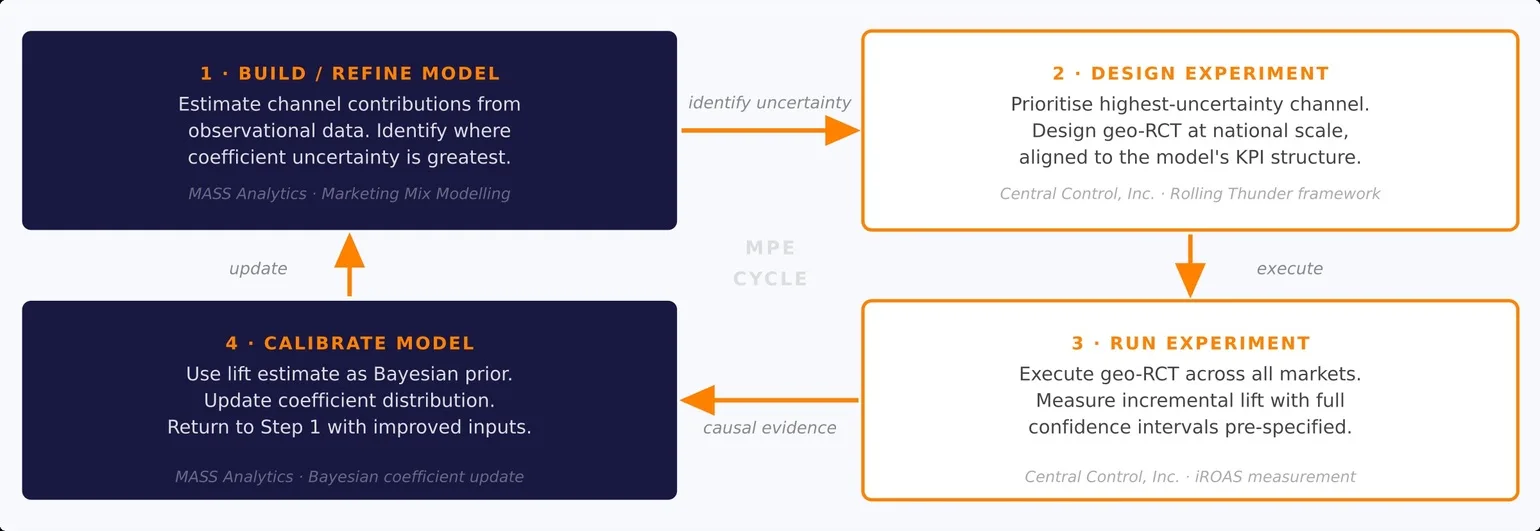
The Compounding Cycle
The loop this creates is the most important structural feature of a mature measurement program:
- The model estimates channel contributions and identifies where coefficient uncertainty is greatest.
- Those channels consequently become the priority candidates for experimentation.
- The experiment produces a causal lift estimate.
- That estimate then calibrates the model.
- The improved model subsequently identifies the next most valuable experiment.
Each cycle compounds the precision and commercial credibility of both the model and the experimental evidence base.
Why Sustained Programs Beat One-Off Experiments
The most common mistake in implementing this approach is treating it as a one-time exercise. A sustained program of experiments that progressively builds a causal evidence library across every major channel is qualitatively different from a single calibration run. Crucially, it is an asset no competitor can replicate quickly, because it requires time, data, and discipline in sequence.
The model identifies where uncertainty is highest. The experiment then targets exactly that uncertainty. The result calibrates the model, and the improved model subsequently identifies the next uncertainty most worth testing. This is a continuously compounding system. A single experiment is a data point; a sustained program is a strategic asset.
What Great CMOs Need: An Executive Playbook for Modern Marketing Mix Modelling
By Dr. Ramla Jarrar and Dr. Firas Jabloun. Be the first to receive it.
When Experiments and MMM Disagree
Sometimes they tell different stories. The experiment may signal a larger uplift than the model estimates, or the model’s coefficient implies more contribution than the experiment can find.
The first instinct is to decide which one is right. That is usually the wrong frame. Divergence between experiments and MMM is a signal to investigate, not a tie-breaker to call.
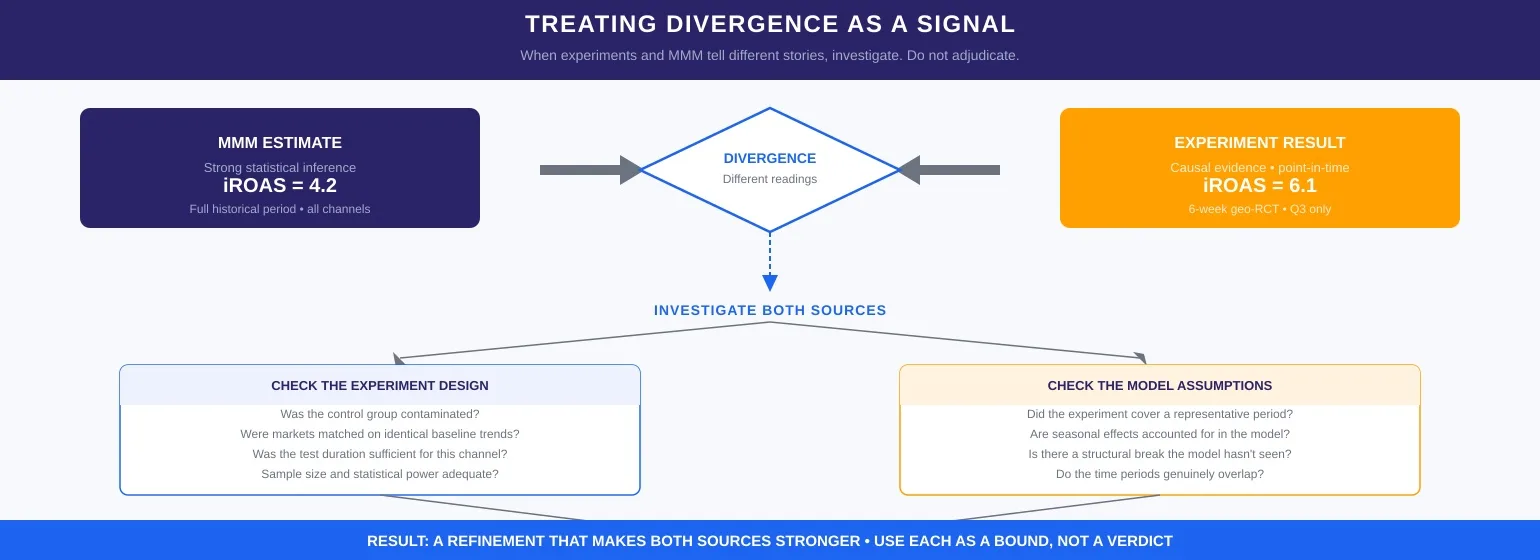
1. Check the Experimental Design
A contaminated control group, markets that were not trending identically before the test launched, or a sample size too small to produce a reliable estimate — each of these can inflate or deflate the measured uplift. Specifically, an experiment that runs for six weeks on 20 markets is not equivalent evidence to a geo-RCT across 210 DMAs.
2. Check the Model Assumptions
If the experiment covers a specific season or market condition that does not represent the broader historical period, the model’s coefficient may reflect a different environment than the one the experiment measured. In such cases, seasonal or structural mismatch is often the culprit.
3. Use Each as a Bound, Not a Verdict
The experiment shows what is possible under test conditions. The model, in contrast, shows what is plausible for planning given the full commercial structure. Rather than overriding each other, the two should inform each other. The goal is calibration that a team can act on with confidence.
“When experiments and MMM tell different stories, treat the difference as the most valuable signal in your measurement program. The answer is almost always a refinement that makes both stronger.”
The Question Your Next Budget Review Will Ask
Marketing budget decisions are defended on evidence. The quality of that evidence determines how much latitude you get. A model result with a confidence interval defends a position; a causal result from a controlled experiment closes the conversation entirely.
The brands that build an integrated measurement architecture — MMM for the strategic view and continuous incrementality testing for the causal layer — are therefore building an evidence base that compounds over time. Each experiment calibrates the model. Each model run, in turn, identifies the next experiment most worth commissioning. As a result, the architecture grows more precise and more credible with every cycle.
If you are running MMM without an incrementality program alongside it, you are answering correlation questions with precision and leaving the causal questions open. Your CFO will eventually ask the causal question. The gap between your model and your proof is ultimately the gap they will stand in.
Ready to close the causal gap?
Talk to MASS Analytics about building an integrated measurement architecture that compounds in precision with every experiment you run.
Key Takeaways
- ✓MMM is the strategic backbone. It covers the full media mix, produces board-defensible ROI estimates, and identifies where experimental evidence would add the most value.
- ✓Incrementality testing adds a causal layer on top. It is the only method that establishes whether advertising caused an outcome under controlled conditions.
- ✓Geographic RCTs are the standard design: privacy-compliant, omnichannel, independent of vendor compliance, and fully auditable.
- ✓The calibration loop is a compounding system. The model identifies uncertain coefficients; the experiment targets them; the result calibrates the model; and the improved model identifies the next experiment worth commissioning.
- ✓Divergence between experiments and MMM is a refinement signal. Investigate both sources rather than adjudicating. The answer almost always makes both stronger.