A MASS Analytics case study: Kellogg’s, a leading global manufacturer of cereal and snack brands, automated its Marketing Mix Modeling process end to end, cutting a typical 8 to 16 week cycle to about 7 days while isolating Trade Promotion’s true contribution with Media held constant.
Sector: FMCG, packaged foods · Scope: one leading Kellogg’s brand, three years of weekly data · Engagement: 2018–2020
Always-ON measurement, delivered on the MassTer platform.
The challenge
For FMCG companies, allocating budget across Media and Trade Promotion is one of the hardest calls a brand team makes. The difficulty compounds further once the long-run impact on brand performance enters the calculation. Kellogg’s data science team set out to answer a specific version of that question. Specifically, what Trade Promotions truly contribute with Media’s effect held constant, for one of the company’s leading brands. Getting a trustworthy answer, however, was only half the task. The team also needed it fast enough to inform the next planning cycle, not the one after it. As a result, the modeling process itself had to become as efficient as the model it produced.
The standard process could not keep pace with the question
Kellogg’s team had been running this analysis on standard, off-the-shelf statistical packages. This was the approach used across most Marketing Mix Modeling projects. Preparing three years of weekly data into a modeling-ready format took a team about a week per refresh. Only then could the team test a single variable. Testing each required specification one at a time stretched a full cycle to 8 to 16 weeks. By the time the team extracted ROI, sales decomposition and saturation, the decision window had often already closed. In the end, instinct, not the model, had usually made the trade-promotion call.
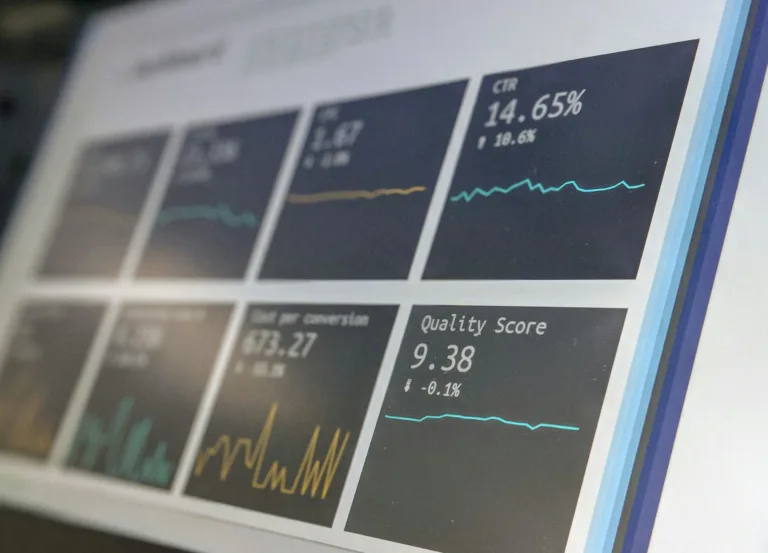
FIGURE 1: Illustrative channel-level output typical of a standard Marketing Mix Modeling build, the depth of detail available before automation. Channel rankings shown are representative; a standard build did not separate Trade Promotion from Media below this view.
“The question was simple: what does Trade Promotion deliver with Media held constant. The standard process took up to two months, and by then the team had already set the promotional plan it was meant to inform.”
A member of Kellogg’s data science team
Four gaps in the standard modeling process
- Data preparation took a week before modeling could start. In practice, standardizing Nielsen, IRI and other syndicated feeds into one modeling-ready format was a manual task. The team repeated it for every refresh, across three years of weekly history.
- Media and Trade Promotion sat inside one combined estimate. Off-the-shelf packages could model total sales. However, isolating what Trade Promotion delivered with Media held constant required a specification most standard builds skip.
- Variable testing was a one-at-a-time exercise. Price, promotion and distribution effects each needed their own specification. In turn, testing that volume of combinations by hand is what stretched a single cycle to 8 to 16 weeks.
- Results arrived after the decision window had closed. By the time a standard build extracted ROI, sales decomposition and saturation, the clock had usually run out. As a result, planners had usually already set the Media and Trade Promotion budget split for the next period.
How automation closed each gap
Each constraint above added weeks to the calendar rather than confidence to the answer. In response, automation addressed all three stages directly, summarized in the table below.
| Process Stage | Approach | What It Does | Finding |
|---|---|---|---|
| Data preparation | Automated pipeline | Standardizes retail syndicated data (Nielsen, IRI and similar sources) into a modeling-ready format | Preparation time cut from about a week to a couple of hours per refresh |
| Variable exploration | Automated exploration | Explores and pre-processes three years of weekly sales, price, promotion and distribution data | Thousands of candidate variables generated and ready for testing in a single run |
| Modeling & optimization | Automated modeling | Fits a proprietary log-linear model via genetic algorithms, then extracts ROI and sales decomposition | Full cycle from data to recommendation cut from 8 to 16 weeks to about 7 days |
TABLE 1: Automation covered every stage from data preparation to optimization, together turning an 8 to 16 week cycle into about 7 days.
The solution
MASS Analytics rebuilt Kellogg’s modeling process end to end. The team built it for speed without sacrificing rigor. It covered everything from data preparation to variable testing and budget optimization. The team fed the same inputs a standard build would use into the pipeline. Specifically, that meant three years of weekly sales volume, price and promotion, and distribution data. This time, however, the data ran through pre-programmed automation rather than manual specification at every stage.
A week of preparation became a couple of hours
An automated pipeline ingests retail syndicated data in whatever format it arrives, Nielsen and IRI included. It then transforms that data into a single modeling-ready structure. For Kellogg’s, that meant three years of weekly sales volume, price and promotion, and distribution data. It also standardized and validated all of it without a manual pass through each feed. The task that previously occupied a dedicated team for about a week now runs in a couple of hours. As a result, that time goes instead to the modeling questions the business actually needed answered.
Automating the model, not just the math
First, the process took Kellogg’s team through two phases. In the exploration phase, pre-programmed processors turned the prepared data into thousands of candidate variables, ready to test. No modeler had to code each specification by hand. In the modeling phase, a proprietary log-linear model fitted through genetic algorithms built automatically. It then extracted Return on Investment and Sales Decomposition instantly. Together, they measured each variable’s impact (Trade Promotions above all), the saturation reached, and the synergy between variables. The combination is what took the question Kellogg’s needed answered, Trade Promotion’s true contribution with Media held constant. In practice, that meant a multi-month build shrank to a same-week one.
Results and Impact
The rebuild’s headline result is speed without compromise. A full Marketing Mix Modeling cycle on standard statistical packages typically ran 8 to 16 weeks. Now, it runs in about 7 days. In fact, that is up to 16 times faster, at the same quality of result.
16x
faster full modeling cycle: 8 to 16 weeks cut to about 7 days
−95%
data-preparation time (about a week to a couple of hours)
1,000s
candidate variables auto-generated and ready to test, per model run
3Y
of weekly sales, price, promotion and distribution data modeled in one run
A full cycle cut from 8 to 16 weeks to about 7 days
The 7-day figure covers the full cycle: from data preparation through to Return on Investment, sales decomposition and budget recommendation. It is not the modeling step alone. Under a standard approach, the same cycle typically ran 8 to 16 weeks depending on scope. So the improvement is a range rather than a single ratio: 8 to 16 times faster, model by model. Automation removed the week of manual data preparation that gated every refresh. Automated variable generation and model-fitting also removed the specification work that had stretched the modeling phase itself. Notably, Kellogg’s data science team confirmed the faster process did not trade away rigor. The log-linear, genetic-algorithm fit ran on thousands of tested variables. By comparison, that is far more than the handful a person could specify in the same window.
Automation freed the team to test the question that mattered
Speed was never the end goal for Kellogg’s data science team. Instead, it was the precondition for answering the real question: what Trade Promotion contributes with Media’s effect held constant. In turn, that shapes the next budget split. A cycle that used to consume most of a planning quarter now leaves room to spare. Kellogg’s can re-run the model against new data and test alternative promotional calendars through predictive scenario testing. And it can do so while the budget conversation is still open. Ultimately, the tool did the automation. The extra time went to the analysis Kellogg’s had wanted to run all along. That is the shift from a periodic report to Always-ON measurement. It is a model that keeps pace with the decisions it needs to inform.
Related case studies
- Promotional Performance: isolating the true incremental impact of individual promotional mechanics for a retailer running complex, overlapping promotional calendars.
- In-House Cost Savings: how a global CPG brand automated data preparation and cut managed-service modeling costs to 30% of prior fees.
- Multi-Product MMM for CPG: modeling 9 SKUs simultaneously, cutting replication time from about 9 hours to seconds.
Want a model this fast?
MASS Analytics runs Marketing Mix Modeling Always-ON, from data preparation to budget optimization, so results arrive while the decision is still open. Talk to our team.
Book a demo