

A perspective from MASS Analytics on why honest MMM ROI requires the multiplicative structure of log-linear models: a contribution in percentages that follows the base, and the synergy that additive models cannot see.
- →Why can two vendors hand the same CMO two different ROI figures from the same data
- →The difference between the ROI you report and the ROI that should drive the budget
- →The two structural failures of additive models: the synergy they cannot see, and the moving base they cannot follow
- →The single equation that turns synergy from an assumption into a tested number
- →How a hidden synergy effect between two channels became a measured performance gain on an unchanged budget
Every ROI figure carries a hidden assumption
Marketing mix modeling ROI is only as reliable as the model that produces it. Two vendors can run the same data through Marketing Mix Modeling (MMM) and hand the same CMO two different ROI figures for the same channel. The difference is rarely the data. It is the structure of the model underneath, and one structural choice matters more than any other: whether the model can see what channels do together.
This article makes three connected arguments. Budget decisions should run on marginal ROI, not average ROI. Marginal ROI is only correct if the model captures synergy between channels. And synergy is something additive models miss by construction, while multiplicative log-linear models measure it by construction.
“An ROI figure is only as honest as the model structure underneath it.”
Average ROI overstates what the next dollar will earn
Average ROI is total incremental revenue divided by total spend. It is a fair summary of past efficiency at the spend level the channel actually ran, and it is correct by definition. The trouble starts when it is used to decide where the next dollar goes.
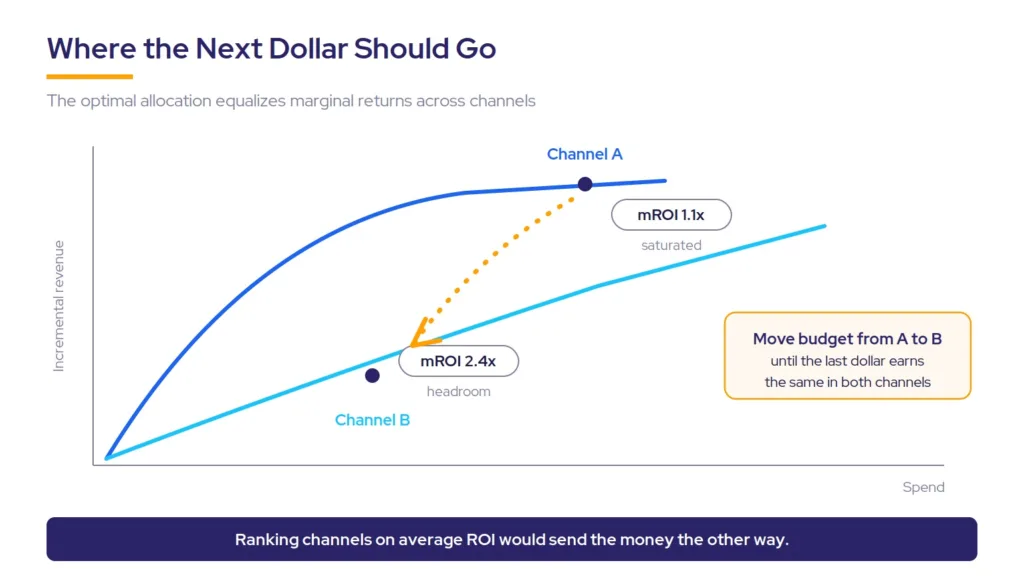
Media response curves flatten as spend rises. Early spend reaches the most responsive audiences; later spend works progressively harder for progressively less. So a channel showing a 4.0x average, $20M of revenue on $5M of spend, might return only $1.3M on the next $1M invested. The average says 4.0x. The margin says 1.3x. Both numbers are true. Only one of them should drive the budget.
This is why marginal ROI, sometimes written as mROI, is the figure budget optimization actually uses. The optimal allocation is the one where the marginal return from the last dollar is equal across every channel. A channel with a spectacular average and an exhausted response curve should lose budget to a channel with a modest average and headroom. Ranking channels on average ROI gets that decision backwards.
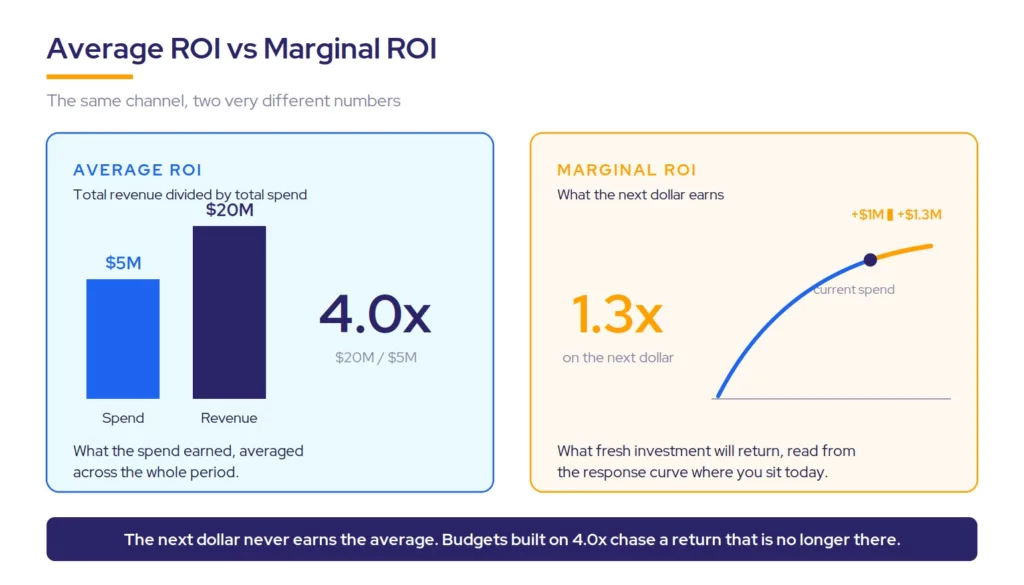
“The next dollar never earns the average.”
Additive models cannot see synergy
A synergy effect occurs when two or more variables running together produce more than the sum of their separate effects. A promotion works harder when TV is advertising it. Display primes an audience that social then converts. Media, marketing, seasonal, and external factors, the usual ingredients of an MMM project, interact constantly.
The classic additive model assumes they do not. Each variable contributes a constant slope, independent of what every other variable is doing. That assumption holds in a stable environment with no interaction between drivers. Real marketing environments are neither.
The commercial consequence is specific and expensive. A channel that works mainly by amplifying another shows a weak solo reading in an additive model. It looks like a candidate for deprioritization in the next plan. Cut it, and the amplification collapses, and the channel it was amplifying falls with it. The interaction the model could not see was quietly absorbed into the base or spread arbitrarily across other media, which means every contribution figure, every average ROI, and every marginal ROI was wrong before anyone opened the budget spreadsheet.
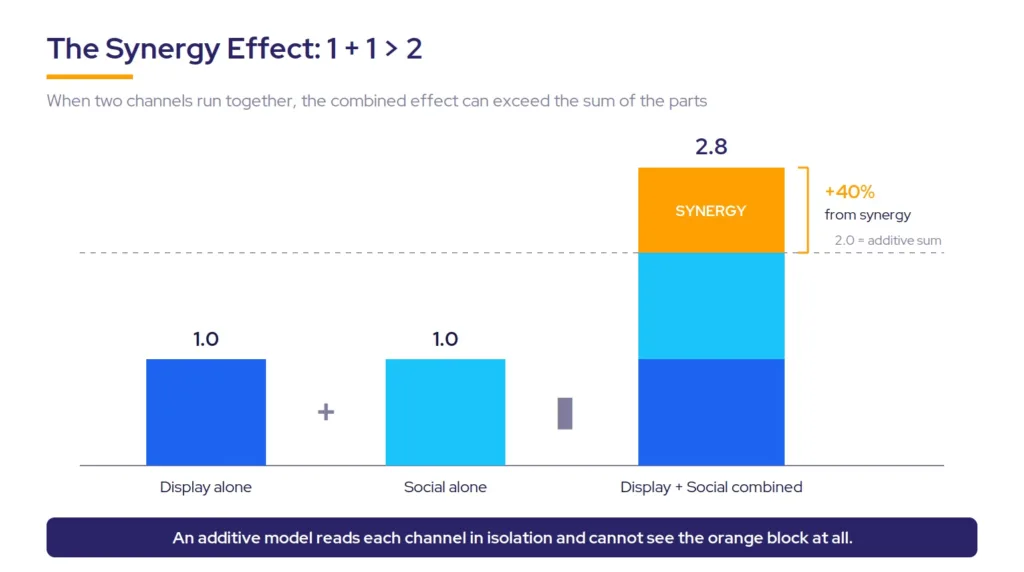
“A model that reads every channel in isolation punishes the channel whose job is amplification.”
A moving base makes the multiplicative form essential, not optional
Synergy is one structural failure of the additive form. There is a second, and it is the one that removes the choice altogether: what happens when the data trends or is strongly seasonal.
In any real business, the base, the sales that would occur before media does its work, is not flat. It rises into peak season and falls out of it, it grows or declines with the trend of the category, and it shifts with distribution and pricing. The base is different in nearly every period of the modeling window.
A linear model cannot follow it. Its structure assigns each unit of media pressure a constant absolute contribution: the same activity is credited with the same number of units in the deepest trough as at the height of the peak, in a growing year and a declining one. That is not how demand responds. Media converts the demand that is present, and there is more of it to convert at the peak than in the trough.
The log-linear form corrects this by construction. Because the model is multiplicative, each variable’s contribution is expressed proportionally, as a percentage uplift on the current base. The same media pressure is credited with an absolute contribution that scales with the season and the trend, because the percentage is applied to a base that moves. The estimated effect stays stable while the delivered volume follows reality.
The accuracy consequences of ignoring this are not cosmetic. Forced to fit one constant onto a moving base, a linear model averages the effect across the window: it over-credits media in low periods, under-credits it in high periods, and pushes the mismatch into the error term and the seasonal controls. The distortion then flows straight into every contribution, every ROI figure, and every budget recommendation built on them. For trending or seasonal data, the multiplicative form is not a stylistic preference among equals. It is a requirement for a model whose contributions can be trusted.
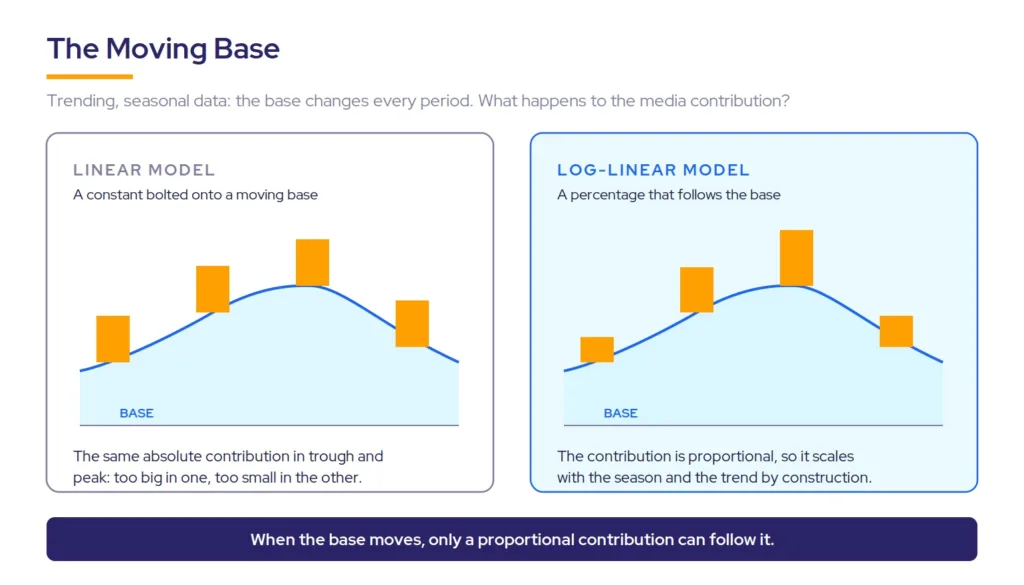
“A percentage follows the base wherever it goes. A constant bolted onto it cannot.”
Multiplicative models measure synergy by construction
The answer is structural, not cosmetic. A log-linear model is a multiplicative specification: the independent variables multiply rather than add, so the effect of one variable scales with the level of the others. We have covered when linear regression fails and log-linear modeling takes over in depth; here the point is what the structure buys you commercially.
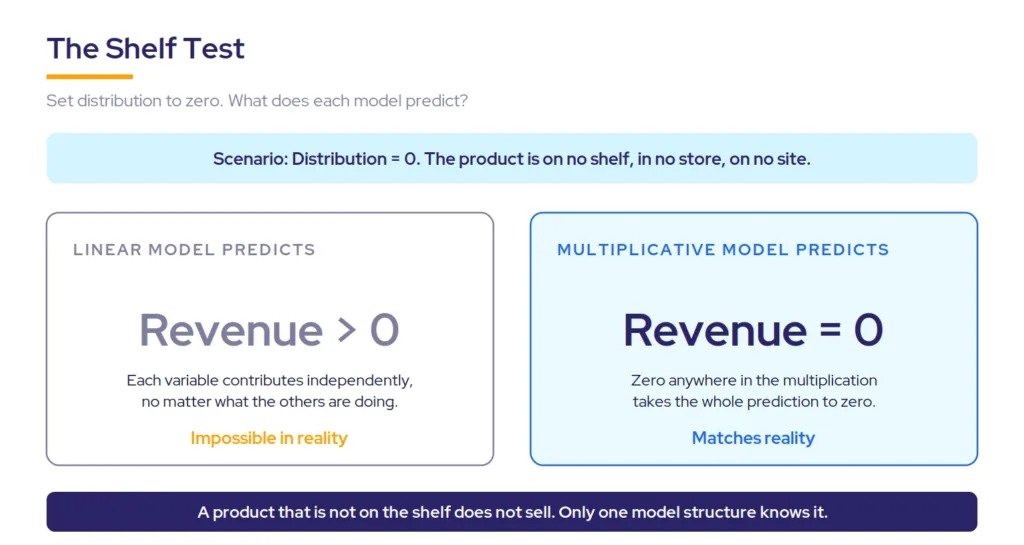
First, realism at the boundaries. Set distribution to zero in a multiplicative model and predicted revenue goes to zero. A product that is not on the shelf does not sell. A linear model predicts finite revenue in the same scenario, because each variable contributes independently no matter what the others are doing.
Second, readable coefficients. Relative variables such as price and distribution produce elasticities in a log-linear model: the percentage change in sales per percentage change in the driver. Incremental variables such as TV produce semi-elasticities. Both read directly into planning language.
Third, and most important here, the interaction term. The hypothesis that two variables amplify each other is tested with data rather than assumed:
The interaction test
Y = B0 + B1 · TV + B2 · Easter + B3 · (TV × Easter)
B1 is the TV effect on its own. B2 is the Easter effect on its own. B3 is the synergy effect: the additional impact when both run at the same time. If B3 is positive, running TV during Easter generates more than the sum of the two individual effects. That is genuine synergy, confirmed by the data.
“In a multiplicative model, synergy is not an adjustment after the fact. It is measured by construction.”
Additive vs multiplicative: the structural contrast at a glance
| Criterion | Additive (linear) model | Multiplicative (log-linear) model |
|---|---|---|
| What each channel’s effect depends on | Nothing else. Each variable has a constant slope regardless of what other drivers are doing. | The level of the other drivers. Effects scale together, the way marketing actually behaves. |
| Synergy between channels | Invisible by construction. The interaction is absorbed into the base or spread arbitrarily across other media. | Measured by construction through interaction terms, tested with data rather than assumed. |
| Contribution when the base trends or is seasonal | A constant absolute contribution regardless of base size: over-credits media in troughs, under-credits it at peaks. | A proportional contribution that scales with the base, following trend and seasonality by construction. |
| Prediction at zero distribution | Finite revenue even with no product on any shelf. | Zero revenue, matching reality. |
| How coefficients read | Unit effects only. | Elasticities and semi-elasticities that translate directly into planning language. |
| ROI reliability | Average and marginal ROI are distorted whenever drivers interact. | Contribution and ROI figures reflect what channels do together. |
| When to choose it | Only in a stable environment with no interaction between drivers. | Whenever channels, promotions, pricing, and seasonality interact. Real marketing environments do. |
Decomposition turns the multiplicative result into numbers a board can read
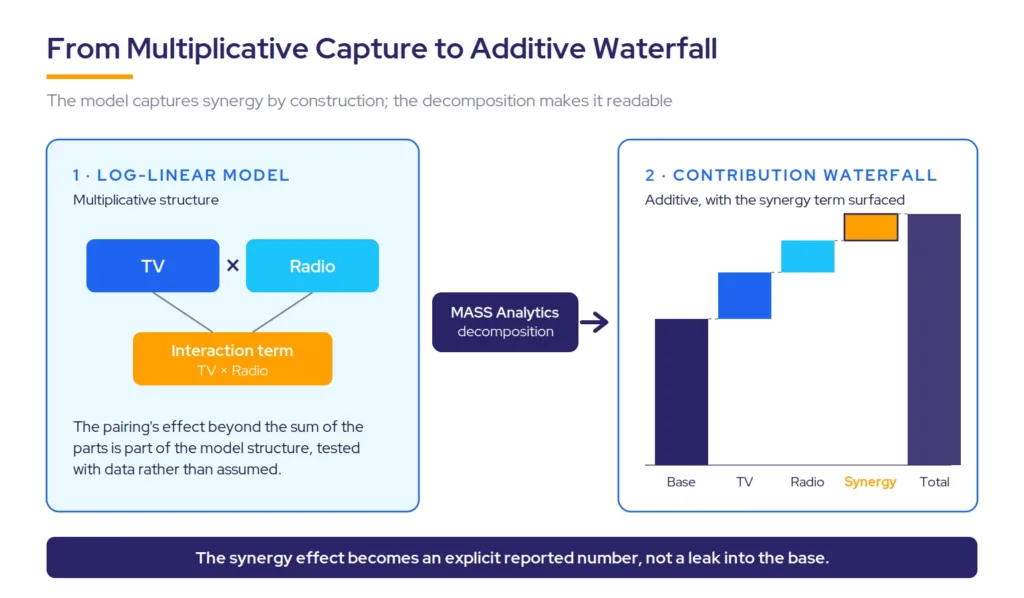
The multiplicative structure creates one genuine challenge. Commercial reporting needs sales expressed as a sum of channel contributions, and a multiplicative model does not naturally produce one. Approximation approaches convert the multiplication into a summation, and every approximation introduces a decomposition error. There is no single correct way to do it; every method trades the size of the error against the soundness of the resulting contributions.
MASS Analytics developed a proprietary decomposition method that minimizes the decomposition error while quantifying the synergy effect between variables explicitly. The synergy term becomes its own reported number instead of leaking into the base, and the adjusted contributions and ROI figures reflect what channels do together. Inside MassTer Mind, those numbers feed directly into budget recommendations, so the pairing a plan should protect is visible before anyone proposes cutting half of it. Where experiments are available, the estimates can be calibrated against incrementality measurement as an additional layer of confidence.
USE CASE · CONSUMER BRAND
The TV and radio pairing a linear model missed
The before-state
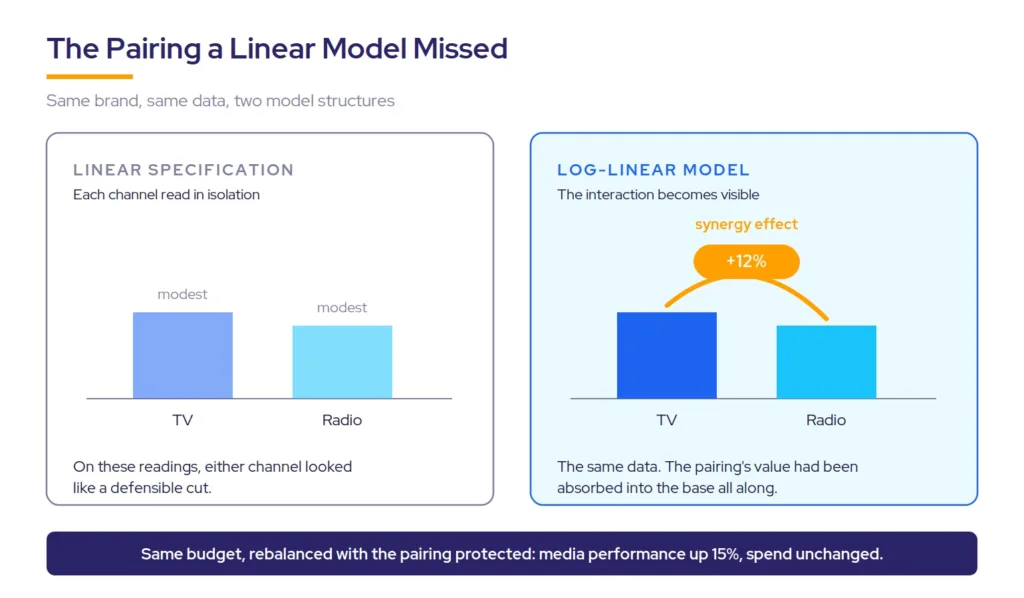
A brand running sustained television and radio alongside each other saw modest individual readings for both channels in an initial linear specification. On those numbers, either channel looked like a defensible cut.
The move to log-linear
Moving to a log-linear model on the same data quantified a 12% synergy effect between the two channels. The additive model had been absorbing that effect into the base and distributing it arbitrarily across other media. Nothing about the media plan changed; the model simply became able to see what the pairing was doing.
The results
With the synergy term recognized, the same total budget was rebalanced between television and radio with the pairing’s value protected. Measured media performance improved 15% with no increase in spend. The insight was not that either channel was strong alone. It was that the model finally priced what they did together.
What this means for your next budget round
Two questions separate a defensible ROI conversation from a misleading one.
First, is the allocation comparing marginal returns across channels, or ranking channels on their averages?
Second, does the model underneath capture synergy, or is it reading every channel in isolation and hiding the interactions in the base?
Modeling approach selection is a decision, not a default, and it determines the type of outcome your measurement can deliver. If you are weighing the options, our guide to agile marketing measurement and the Comprehensive MMM Guide cover the trade-offs, and the End-to-End MMM Course walks through the mechanics hands-on. If you want to see the decomposition working on your own data, book a demo.
The models that hold up under the next decade of budget scrutiny will be the ones that measure what channels do together, report it honestly, and tell the CFO exactly what the next dollar will earn.
- ✓Average ROI tells you what your spend earned historically. Marginal ROI tells you what the next dollar will earn. Budgets built on the average consistently overinvest in saturated channels.
- ✓Additive models cannot see synergy. Every channel is read in isolation, so a channel whose main job is amplifying another looks weak and gets cut, taking the amplified channel down with it.
- ✓When data trends or is seasonal, the base moves every period. A linear model bolts a constant contribution onto it; a log-linear contribution is proportional, so it follows the base. For such data the multiplicative form is an accuracy requirement, not a preference.
- ✓Multiplicative log-linear models measure synergy by construction. The interaction between channels is part of the model structure, tested with data rather than assumed.
- ✓MASS Analytics’ proprietary decomposition converts the multiplicative result into an additive contribution waterfall, minimizes the decomposition error, and reports the synergy effect as an explicit number.
Frequently asked questions about marketing mix modeling ROI
Marketing mix modeling ROI is the return on investment a marketing mix model estimates for each channel: the incremental revenue a channel generated divided by its cost over the analysis period. Unlike platform-reported ROI, it is derived from the modeled incremental effect of the channel on sales, which accounts for base demand, seasonality, pricing, and other drivers. The reliability of the figure depends directly on the model structure used to produce it.
Average ROI is total incremental revenue divided by total spend across the period, a summary of past efficiency at the spend level the channel actually ran. Marginal ROI is the return generated by the next dollar of spend. Because media response curves flatten as spend rises, marginal ROI is usually lower than average ROI. A channel can show a 4.0x average while the next dollar returns 1.3x. Budget allocation decisions should compare marginal ROI across channels, not average ROI.
mROI stands for marginal return on investment, sometimes written as marginal ROI. It measures the revenue generated by the next unit of marketing spend in a channel, rather than the average across all spend to date. In marketing mix modeling, mROI is read from the channel’s response curve at the current spend level and is the figure budget optimization uses: the optimal allocation is the one where marginal returns are equal across every channel.
A synergy effect occurs when two or more marketing variables running together produce a combined effect greater than the sum of their separate effects. A typical example is TV advertising amplifying a promotion, or display priming an audience that social then converts. In marketing mix modeling, synergy is captured through interaction terms in multiplicative model structures. A model that omits synergy reads every channel in isolation and misattributes the interaction, usually to the base or arbitrarily across other media.
A log-linear model is a multiplicative specification: independent variables multiply rather than add, so the effect of one variable scales with the level of the others. This structure lets the model estimate an explicit interaction term between two channels and report what the pairing adds beyond the individual contributions. A positive interaction coefficient confirms genuine synergy, tested with data rather than assumed. Additive linear models cannot do this by construction, because each variable’s effect is independent of every other variable.
When data trends or is strongly seasonal, the base level of sales changes from one period to the next. A linear model assigns each unit of media pressure a constant absolute contribution regardless of base size, so it credits the same activity with the same volume in a trough as at a peak. A log-linear model expresses each contribution proportionally, as a percentage uplift on the current base, so the delivered contribution scales with the season and the trend. On trending or seasonal data, a linear specification over-credits media in low periods, under-credits it in high periods, and pushes the mismatch into the error term, which distorts contributions and ROI. This makes the multiplicative form a requirement for accuracy on such data rather than an optional refinement.
A multiplicative model produces results that cannot be read as a simple sum of channel contributions, which is what commercial reporting requires. MASS Analytics developed a proprietary decomposition method that converts the multiplicative result into an additive contribution waterfall while minimizing the decomposition error the approximation introduces. The method quantifies the synergy effect between variables explicitly, so the reported contributions and ROI figures reflect what channels do together, and the synergy term is visible as its own reported number rather than absorbed into the base.