

Dr. Ramla Jarrar of MASS Analytics on how marketing budget allocation decides where the next dollar goes, and why the highest-ROI channel is often the wrong place to put it.
- →What marketing mix optimization is, and the questions it answers
- →Why diminishing-returns curves, not ROI rankings, are the real engine
- →Why the highest-ROI channel is often the wrong home for the next dollar
- →How the allocation is computed, one increment at a time
- →What good optimization is worth, with results from three client engagements
Marketing mix optimization is the process of deciding where your next marketing dollar should go. Not where the last one went. Not where the highest return sits today. Where the next one earns the most.
Once a Marketing Mix Model is built, you know the contribution and the return of every channel. Optimization is the step that turns that measurement into a budget: given your objective and your constraints, what allocation produces the best outcome?
It sounds like a ranking exercise. Rank the channels by ROI, feed the winners. It is not, and the reason it is not is the most important idea in this article.
Optimization is not about funding your highest-ROI channel. It is about funding the channel that returns the most on the next dollar, which is rarely the same thing.
What marketing mix optimization actually is
Marketing mix optimization is the process of finding the marketing budget allocation that best meets an objective you set, under the constraints you set. It answers the questions every planning round comes back to. What total budget do I need to hit the target? How should that budget split across channels? Can I hold revenue while spending less?
It is the deployment step, the part of the Marketing Mix Modeling workflow that comes after the model is trusted. Optimization only gives meaningful answers if the modeling underneath it was done properly. Weak curves in, confident nonsense out.
For the full concept of marketing mix optimization and how it fits the broader measurement-to-budget workflow, see our complete guide to marketing mix optimization.
The engine is the diminishing-returns curve, not the ROI table
Every channel has a response curve: spend on the horizontal axis, incremental revenue on the vertical. The curve is concave. The first dollars work hard, and each additional dollar earns a little less than the one before. Push far enough and the curve flattens. That is saturation, the point where the next dollar buys almost nothing.
This curve, one per channel, is the real input to optimization, not a single ROI figure. ROI is an average across all the spend in a channel. Optimization runs on the margin: what the next dollar will do, not what the whole budget already did. The band where the next dollar is still worth spending is what we call the optimal execution range.
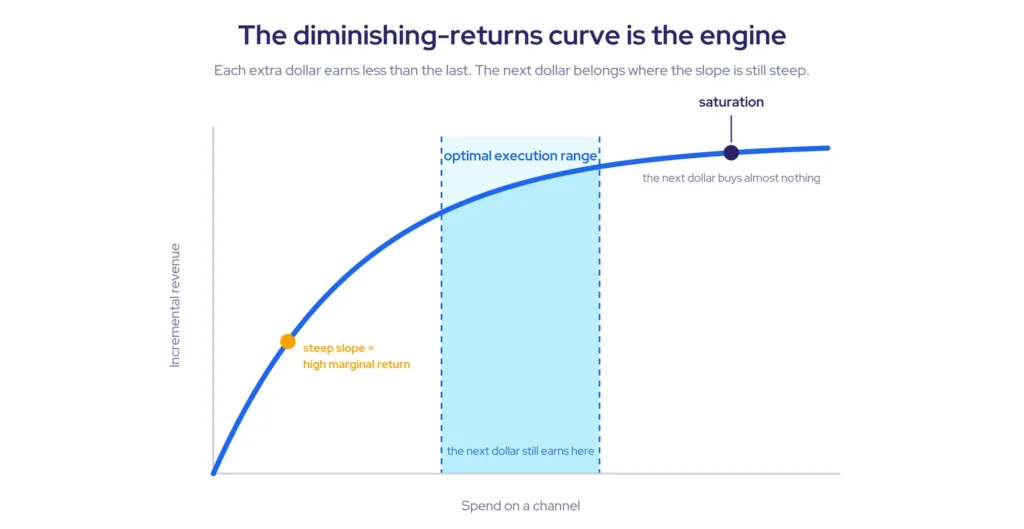
ROI is an average. Optimization runs on margins. The question is never what a channel returned, it is what the next dollar will return.
Why the highest-ROI channel is often the wrong answer
Here is the case that makes the point. Say TV has a higher ROI than Search. The instinct is to move money into TV. But suppose TV is close to saturation and Search is not.
Move one dollar from TV to Search. You lose a little revenue on TV, because at saturation its marginal return is small. You gain more on Search, because its curve is still steep. The loss is smaller than the gain, so total revenue goes up, even though you just took money out of your highest-ROI channel.
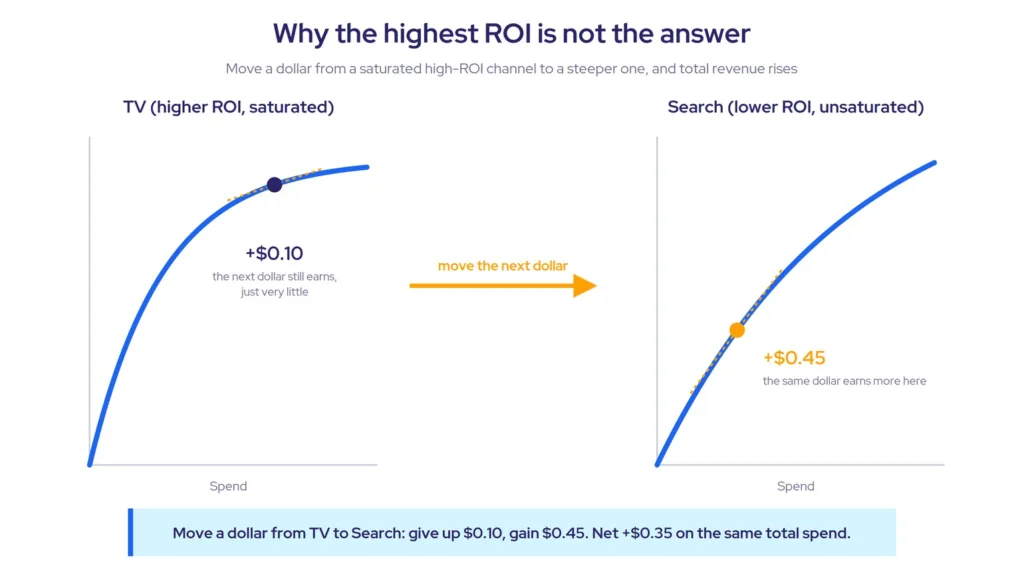
That is the whole game. You are not chasing the best average. You are balancing marginal returns across channels, moving dollars until the next dollar would earn about the same everywhere.
How marketing budget allocation is actually computed
The logic is easier than it sounds. Split the budget into increments. For the first increment, look at every channel’s curve and place the money where the slope is steepest, where the marginal return is highest. Recompute the slopes, since that channel is now a little more saturated, and place the next increment. Repeat until the budget is spent.
A worked version: three channels, TV, Radio and Display, and a budget to allocate. The first increment goes to whichever curve is steepest at the start. The second goes to whichever is steepest now. Step by step, the budget flows to wherever the next dollar earns the most, and stops flowing to a channel the moment another one overtakes it.
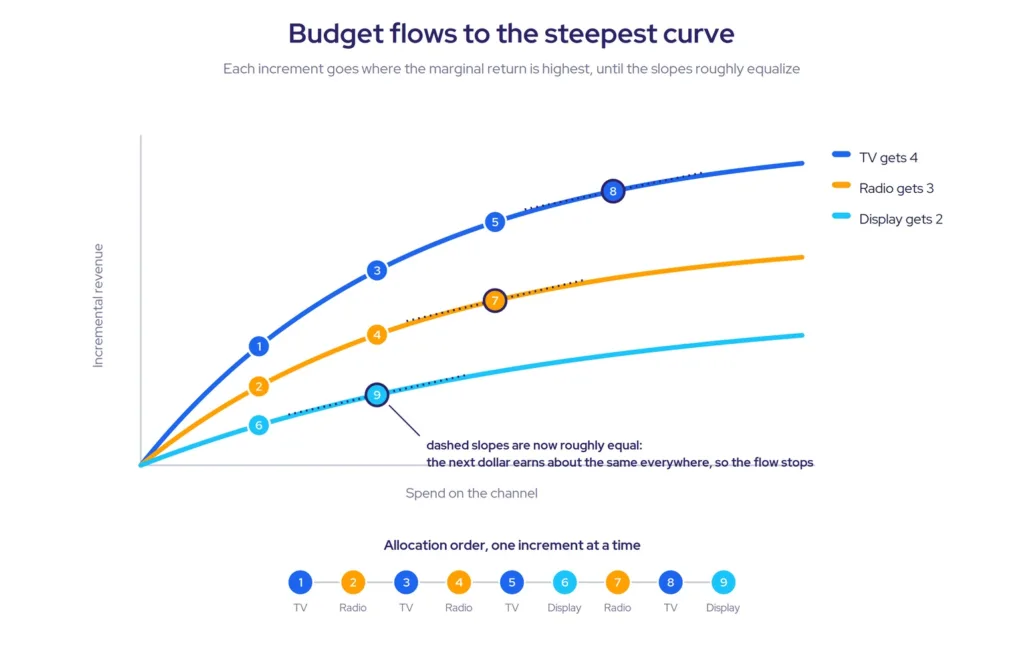
Real optimizers, MassTer Mind among them, do this at fine granularity and under real constraints: a total budget, a date range, and floors and ceilings per channel so the math respects contracts and commitments. The principle does not change. The quality of the answer depends on the curves themselves, which is why we wrote up building diminishing return curves after modeling is a mistake.
The curves have to be sensible: concave or S-shaped
Two shapes go into optimization. A concave curve shows diminishing returns from the first dollar. An S-shaped curve shows a slow build, a steep middle once a threshold of exposure is reached, then diminishing returns, which fits channels that need to be seen enough times before they work.
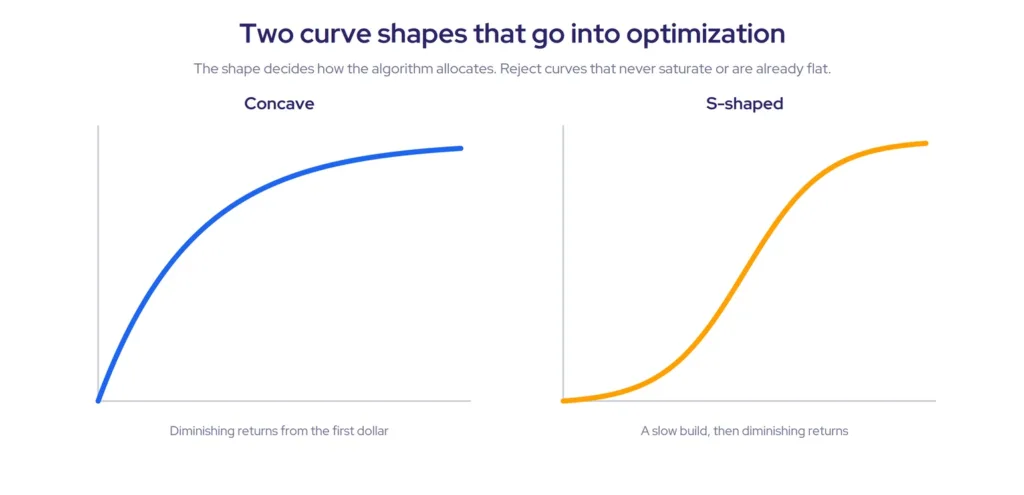
What you cannot accept is a curve that never saturates or one that is already flat. A curve that never bends tells the optimizer to pour everything into one channel. A fully saturated curve tells it to spend nothing there. Neither reflects reality, so building sensible curves is a judgment call, and it is where an experienced modeler and a media expert earn their place. There is more on how optimization fits the wider MMM workflow if you want the deployment view.
It gets harder, and more valuable, at portfolio scale
Optimizing one channel for one product is the easy case. Real businesses run many brands across many markets, sharing channels that saturate at different rates for each. Search may be saturated for one product and wide open for another. Most of the budget sits on a few brands, and as they saturate, the question becomes which brand deserves the next dollar. Halo effects, where spend on one brand lifts another, make the math harder still.
This is where a single-product optimizer stops being enough and portfolio-level optimization software earns its keep.
What good optimization is worth
The upside is not theoretical. On a personal-care brand we modeled, one channel was running at 96 percent saturation. Its average ROI still looked healthy on the reporting, which is exactly how averages mislead. The optimizer moved that budget into channels with room to grow, and total media-driven revenue rose 5.5 percent on the same spend.
For an international airline, the objective ran the other way: protect revenue while cutting cost. Optimization delivered a 17 percent improvement in marketing ROI while total media spend came down 15 percent. That is the third question from the top of this article, hold revenue while spending less, answered in production.
And for a global retailer, reallocating across a large portfolio lifted media-driven revenue by 18 percent, roughly $30 million, and moved marketing ROI from 13 to 15.5.
The published evidence points the same way. In an award-winning Marketing Science paper, Fischer and colleagues modeled Bayer’s primary-care portfolio and found that a better allocation pointed to a 55 percent increase in discounted profit over five years, worth roughly 493 million euros.
From optimization to a decision you can commit
Optimization gives you the mathematically best allocation. It does not, by itself, give you a decision. A plan still has to face the real world, competitors, seasonality, the economy, and be stress-tested before anyone signs it.
That is why we built MassTer Mind. It runs this optimization on top of a finished model, whatever platform built it, then lets you simulate the plan, layer external conditions, and compare options before you commit. Inside our Always-ON platform, optimization is the engine and the decision is what you do with it.
Frequently asked questions
Marketing mix optimization is the process of finding the marketing budget allocation that best meets an objective, such as maximizing revenue, under set constraints. It uses the diminishing-returns curves from a Marketing Mix Model to decide how much each channel should get, and it answers questions like what total budget hits a target and how to hold revenue while spending less.
It works on the margin. Each channel has a response curve showing how incremental revenue rises with spend. The optimizer allocates budget in increments, always placing the next increment where the marginal return is highest, then recomputing. It stops when the next dollar would earn about the same across channels, which is the mathematically best allocation.
Because ROI is an average and optimization runs on the margin. A high-ROI channel near saturation returns very little on its next dollar. A lower-ROI channel that is still unsaturated can return more on its next dollar. Moving budget to the steeper curve raises total revenue even though you spent less on the higher-ROI channel.
A concave curve shows diminishing returns from the first dollar. An S-shaped curve shows a slow start, a steep middle once a threshold of exposure is reached, then diminishing returns. Both are valid, and the shape changes how the optimizer allocates, which is why choosing sensible curves matters.
Optimization starts from an objective and returns the best allocation. Simulation starts from a plan you choose and returns the outcome it should produce. Optimization finds the answer; simulation tests the specific plans your team is weighing. A complete planning process uses both.
Yes, and it is where optimization gets hard. Channels saturate at different rates across products and markets, budgets concentrate on a few brands, and halo effects link them. Portfolio-level optimization handles these interactions to find the best overall allocation, not just the best per product.
The question to ask before the next plan
Before you approve the next plan, ask where the next dollar earns the most, not which channel looks best on an ROI chart. Those are different questions, and only one of them grows the business.
- ✓Marketing mix optimization decides where the next dollar goes, using each channel’s diminishing-returns curve, not a table of average ROIs.
- ✓The highest-ROI channel is often near saturation, so its next dollar earns little. The best next dollar usually sits on a steeper curve.
- ✓The allocation is computed on the margin, one increment at a time, until the next dollar would earn about the same everywhere.
- ✓Curves must be sensible, concave or S-shaped, never flat and never non-saturating, which takes modeler judgment.
- ✓Optimization gives the math. Turning it into a committed plan means testing it against the real world first.
For the full workflow behind these ideas, from building the model to reading the curves, see our Comprehensive Marketing Mix Modeling Guide.