

- →Why the regression behind modern Marketing Mix Modeling is not the textbook line from a statistics course
- →The single question that should decide any modeling method, long before anyone mentions neural networks
- →What the four OLS assumptions are really protecting, in commercial terms
- →Which diagnostics decide whether your number survives a CFO’s scrutiny
- →Where transparency stops being a preference and becomes a requirement
In the view of MASS Analytics, regression is not obsolete. Every few years, someone declares regression obsolete. The argument runs the same way each time: marketing data is complex, machine learning is powerful, so why measure the marketing mix with a method that predates the internet. It is a fair question. It also rests on a misunderstanding of what regression in Marketing Mix Modeling (MMM) actually is.
The regression behind a modern marketing mix model is not the single straight line from a first-year statistics course. It is the foundation that log-linear, nested, hierarchical, pooled, and Bayesian models are all built on. We kept it, and built layer after layer on top of it, because it works. And because it does something no black box can: it tells you not only what worked, but why.
Regression is the engine, not the relic
When the board asks what your media delivered, or the CFO challenges whether the budget is working hard enough, the answer has to come from somewhere rigorous. Regression is that foundation. It connects investment to commercial outcomes through evidence drawn from your own data, not through assumptions.
The version used in MMM today powers log-linear models that capture how channels amplify one another, nested models that separate the channels which create demand from those that merely capture it, and hierarchical and pooled models that handle the granularity brands now collect across products, regions, and segments. Each of these is regression, extended.
The lineage matters for a simple reason. Every budget recommendation you present traces its credibility back to whether the model underneath it is statistically sound. When a CFO tests your ROI figures, the quality of that framework is what decides whether your answer holds or collapses.
The regression behind a modern marketing mix model is not the straight line from a statistics textbook. It is the foundation that log-linear, nested, hierarchical, and Bayesian models are all built on.
The right question is fit, not fashion
Why not neural networks?” is the wrong place to start. The right question is older and harder: am I solving a real business problem, or am I satisfying my curiosity? The method has to fit the problem. If the question is simple, the model should be simple. As a program matures and the questions deepen, the technique evolves with them. Complexity the question does not require is not sophistication. It is risk you cannot explain to the person signing off the budget.
Some have read the arrival of open-source Bayesian packages, Google’s Meridian, Meta’s Robyn, PyMC-Marketing, as proof that the methodology is now easy. It is proof the industry takes it seriously, nothing more. A model in the wrong hands, built on poorly designed priors, will produce results less reliable than a well-specified classical regression. The tool was never the value. The value is the combination of statistical expertise, business understanding, and command of the tool, brought to a question that deserves it. I have said for years that MMM is 70 percent business and consumer understanding, 30 percent statistics. No package changes that ratio.
The right question is never which technique is most advanced. It is whether you are solving a business problem or satisfying your curiosity.
What ordinary least squares actually requires
Strip MMM back to its core and you find ordinary least squares (OLS): the method that fits a line by making the total of all squared distances between the data and the model as small as possible. The mechanics of regression in MMM produce measurements you can trust only when four assumptions hold, and each one protects a commercial decision further down the line.
The relationship must be linear in its parameters, which is why practitioners transform response curves for adstock and diminishing returns before they enter the model, rather than forcing them on afterwards. The independent variables must not move too closely together, because when two channels rise and fall in lockstep, OLS cannot tell you which one moved sales. The variance of the errors must stay constant, or the significance tests stop being reliable. And the errors must be independent from one period to the next, because a repeating pattern in the residuals is a real driver of sales sitting unmodelled.
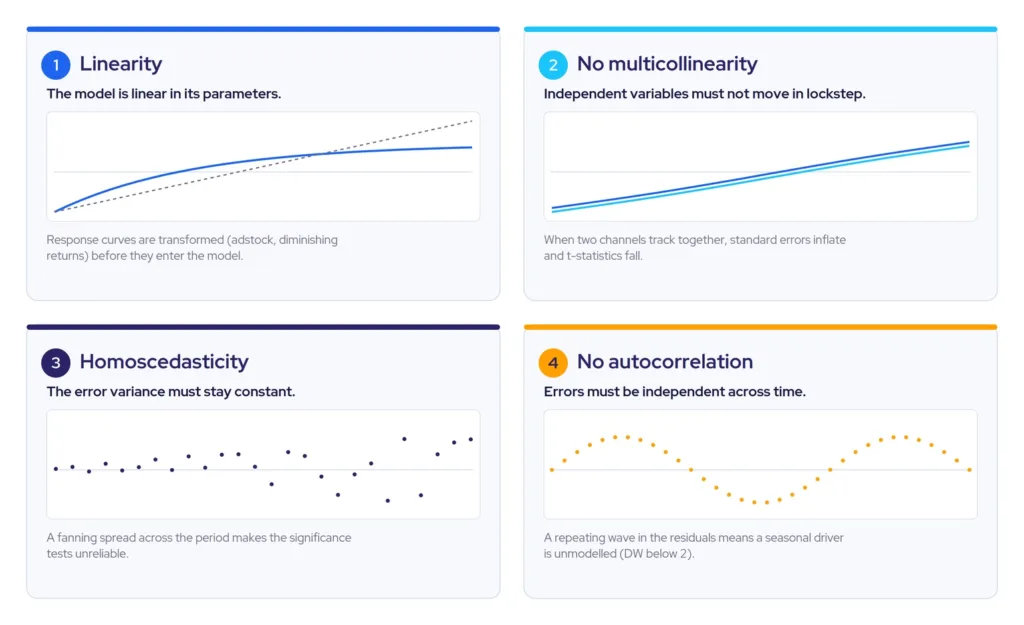
None of this is academic. A team that ignores the assumptions produces numbers that look precise and are systematically wrong.
That is why the team puts every finalized model through residual analysis before presenting a single result. Well-behaved residuals scatter randomly around zero, hold a constant spread, and follow an approximately normal distribution. A pattern in them is the model telling you something is missing.
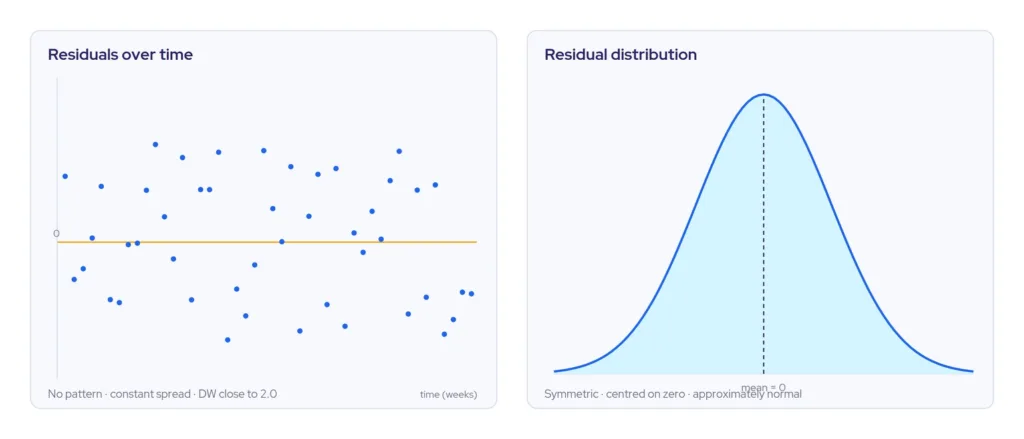
OLS produces numbers you can trust only when four assumptions hold. Ignore them and the model returns figures that look precise and are systematically wrong.
The diagnostics that decide whether your number holds
A model’s credibility lives in its diagnostics, and a CMO does not need the mathematics to read them. R squared tells you how much of the movement in sales the model explains: an R squared of 0.88 means it accounts for 88 percent of the variation across the period.
But R squared carries a trap. It rises every time you add a variable, whether or not that variable means anything commercially. A modeller who adds a dummy for every unusual week can manufacture a high R squared and a worthless model, one that has memorised the past rather than understood it.
This is why you should never read R squared alone. Adjusted R squared rewards only the variables that genuinely improve the model. MAPE, the average percentage by which the model’s weekly prediction misses actual sales, translates fit into a sentence a CFO can act on: below 10 percent is excellent, 10 to 20 percent is acceptable, and above 20 percent should stop a result before it reaches a budget meeting.
Then there is the t-statistic, which measures how reliably a single coefficient stands apart from zero. This is the diagnostic that matters most before you act, because a model can be robust enough to optimize one channel and entirely unsafe to scenario-plan on another.
The discipline behind all of it is one question, asked of every variable in the equation: does this have a documented commercial reason to be here? If the answer is no, the fit inflates and you cannot trust the conclusion.
R squared rises every time you add a variable, meaningful or not. A model can post a high R squared and still have memorised the past rather than understood it.
From one line to a layered system
Simple linear regression has almost no real use in MMM. Media, price, distribution, promotions, seasonality, competitor activity, the economy, and the occasional cultural event all shape consumer behavior at once. Multiple regression holds all of them in a single equation and estimates each factor’s effect while holding the others at their observed levels. That is what makes a coefficient commercially meaningful: it is the change in sales associated with one more unit of a channel, with everything else accounted for.
From there the layers begin. Log-linear modeling captures the way channels amplify one another. Nested modeling resolves one of the most expensive errors in measurement: the moment a channel that merely captures existing demand, most often branded paid search, receives credit for creating it. In one streaming-platform project, treating branded search correctly as an endogenous variable was the difference between handing inflated credit to the capturing channel and getting an honest read on the channels actually generating demand. Hierarchical models roll results up and down a portfolio of products and regions. Bayesian regression brings in what the team already knows, from previous projects and experiments, when the data alone is too thin or too noisy to speak clearly. Every one of these is regression, asked a harder question.
Branded paid search is one of the most consistently misattributed channels in MMM. It captures demand it did not create, and a naive model hands it the credit.
Transparency is the part a black box cannot give you
There is a reason finance trusts a regression result in a way it rarely trusts an opaque one. The CFO conversation carries a requirement the model has to meet: full visibility into how the team produced the number. The assumptions, the inputs, the model logic, the calibration, all of it open to inspection. Transparent, interpretable models are not a stylistic preference here. A result you can interrogate is a result you can defend, and a result you can defend is one that holds when finance challenges marketing’s claim on the budget. This is also why calibration matters. A validated model tells the board what the data shows happened. A model whose coefficients a controlled experiment has verified tells them why, and hands finance a number it cannot wave away. Regression delivers that line of sight by construction. A black box, by construction, cannot. And when the read is both transparent and current, the same contribution, ROI, and saturation estimates serve the CMO planning next quarter and the CFO auditing the last one. The argument stops being about which framework to trust and becomes the one worth having: what to do next.
A result you can interrogate is a result you can defend. That line of sight is exactly what a black box, by construction, cannot give you.
Common questions about regression in MMM:
No. The regression used in modern MMM is not the single-line model from a statistics course. It is the foundation beneath log-linear, nested, hierarchical, pooled, and Bayesian models. It remains the standard because it is robust and, unlike most machine-learning alternatives, it explains why a channel worked rather than only that it did. That explanation is what lets a CMO defend the number when it is challenged.
Because MMM has to be explainable. A marketing mix model often produces several statistically valid options, and the team has to choose the one that makes commercial sense as well as statistical sense. That judgement needs an interpretable structure, which regression provides and most black-box methods do not. Machine learning has its uses, but when a CFO challenges an ROI figure, an interpretable model is what holds up.
Three things. The four OLS assumptions hold, confirmed by residual analysis rather than assumed. The diagnostics are read honestly, with adjusted R squared and MAPE alongside R squared and the t-statistic checked on any coefficient before it is used. And every variable has a documented commercial reason to be in the model. For the full workflow, our Comprehensive Marketing Mix Modelling Guide walks through each step. Without that discipline, the fit can look strong and still mislead.
Ordinary least squares relies on four. The relationship must be linear in its parameters, which is why media response curves are transformed before they enter the model. The independent variables must not be too highly correlated. The variance of the errors must stay constant. And the errors must be independent across time. Residual analysis checks all four, and if any is violated the model is revised before its numbers are trusted.
An R squared of roughly 0.85 to 0.90 is common, meaning the model explains most of the variation in sales, but it should always be read with adjusted R squared because R squared rises with every variable added. MAPE is the practical complement: below 10 per cent is excellent, 10 to 20 per cent is acceptable, and above 20 per cent should send the model back for review before it guides spend.
Branded paid search usually captures demand that other channels created, rather than creating it. A standard regression credits it with that demand, inflating its ROI and understating the channels that did the work. Nested modelling, using two-stage least squares, separates the demand branded search captures from the demand it generates, so each channel is measured on its real contribution.
The question to take into your next budget meeting
The next time a vendor tells you regression is the old way of doing things, ask a sharper question than the one they are answering. Not which method is newest, but which one you could defend, line by line, in front of a CFO who has every reason to doubt the number. Then ask whether the model behind your current budget could survive that conversation. If you cannot answer with confidence, that is not a reason to reach for a more complex method. It is a reason to look harder at the one you already have.
- ✓The regression in modern MMM is the engine beneath log-linear, nested, hierarchical, pooled, and Bayesian models, not a dated alternative to them.
- ✓The method should fit the question. Complexity the business problem does not require adds risk you cannot explain, not rigour.
- ✓Four OLS assumptions decide whether a model’s numbers can be trusted, and residual analysis is the check, not an optional extra.
- ✓Read adjusted R squared and MAPE alongside R squared, and check the t-statistic on any coefficient before acting on it; a high R squared on its own can hide a model that only memorised the past.
- ✓Transparency is what lets a regression result survive finance scrutiny, and it is exactly what a black box cannot offer.