

MMM vs MTA is the wrong question. Dr. Ramla Jarrar of MASS Analytics explains what marketing mix modeling and multi-touch attribution each measure, and when to run both.
- → The category error at the heart of the MMM vs. MTA debate
- → The structural blind spot in multi-touch attribution’s coverage, and where cut brand budgets go to hide
- → How iOS 14 and cookie restrictions changed the balance between the two methods
- → A dimension-by-dimension evaluation framework comparing MMM, MTA, and experimentation
- → A three-filter routing rule that decides which method answers which question
Should we use marketing mix modeling or multi-touch attribution? I have heard some versions of this question for twenty years, and my answer has not changed: MMM vs. MTA is the wrong fight. The two methods measure different parts of the same commercial system, and a team that picks one and discards the other is choosing where to be blind. The debate refuses to die. It is the most recurring measurement question on Quora, on Reddit, in Medium explainers, and in almost every RFP that reaches my desk. So let me answer it properly, from first principles, and then give you the rule that makes the question disappear.
The two methods were built for different jobs
Marketing mix modeling comes from econometrics. Put simply, it reads the relationship between aggregate marketing investment and aggregate business outcomes over weeks, months, and years, and it does so without touching a single user-level record.
If you want the foundations first, start with our explainer on what marketing mix modeling is and how it works. Alternatively, go deeper with the Comprehensive MMM Guide.
Multi-touch attribution comes from digital ad tracking. It follows an individual customer’s path to conversion and assigns fractional credit to each tracked touchpoint along the way. First touch, last touch, linear, time decay: in other words, these are simply different rules for splitting the same credit.
MMM tells you that paid search contributed 8% of last quarter’s revenue at an ROI of $2.40. Attribution tells you that one specific conversion was preceded by a display impression, two search clicks, and an email open, then splits the credit across those touches. In short, these are not competing answers to one question; they are answers to two different questions.
MMM measures the strategic outcome at the aggregate level. Attribution measures the tactical journey at the user level. Neither can do the other’s job.
Attribution only sees what it can track
Attribution’s weakness is not its math. It is its coverage. Television, out-of-home, sponsorship, retail activity, partnerships, and most brand investment never generate a trackable touchpoint. To an attribution model, this activity does not exist. As a result, the conversions it drives still arrive, but they arrive labeled as organic, direct, or base.
Here is the commercial consequence. Everything attribution cannot track accumulates as organic conversion, and organic conversion never asks for budget. Consequently, nobody decides to cut brand. The dashboard decides it, one reallocation at a time.
Budget follows credit, and credit follows visibility. A measurement system that can only see digital touchpoints will, over enough planning cycles, shift spend toward the digital tactics it can see and starve the brand and offline activity that feeds the base.
“Attribution measures the journey it can see. MMM measures the business, whether the journey was tracked or not.”
The privacy era demoted attribution, it did not kill it
If the debate feels louder since 2021, that is because the ground moved. Apple’s App Tracking Transparency arrived with iOS 14.5, browsers restricted third-party cookies, and the platforms consolidated into walled gardens that do not share user-level data with each other. Each change removed signal that attribution models depend on. As a result, the journeys attribution stitches together today have holes in them, and the holes are not random.
This is the real story behind the MMM resurgence you keep reading about. MMM needs no user-level data at all. It runs on aggregate time series the business already owns: spend, impressions, sales, pricing, seasonality. Therefore, privacy regulation cannot take away what the method never used.
But resurgence is not a funeral for attribution. Inside tracked platforms, attribution still delivers what MMM cannot: a reading within hours, at the level of a creative variant or an audience segment, while the campaign is still live. The correct conclusion is a demotion, not an execution. Attribution moves from sole arbiter of marketing value to one instrument among three.
MMM, MTA, and experimentation compared, dimension by dimension
The cleanest way to evaluate the three methods is to stop asking which is best and score them on the dimensions that decide fitness for a given question. Six dimensions do most of the work.
| Dimension | MMM | Multi-touch attribution | Experimentation |
|---|---|---|---|
| Granularity | Aggregate: channel and campaign | User level: touchpoint by touchpoint | Treatment vs. control group |
| Time horizon | Strategic: weeks to years | Real time to weekly | Point in time, test duration |
| Coverage | All activity, tracked or not | Digitally tracked only | The treatment under test |
| Type of evidence | Strong statistical inference | Correlational credit assignment | Causal proof |
| Data requirement | Two years plus of aggregate data | User-level touchpoint tracking | Randomization and a control group |
| Privacy exposure | None: no personal data used | High: depends on user-level tracking | Low: reads group-level outcomes |
Table 1 · The three measurement methods evaluated across six dimensions. Each row marks where one instrument is strong and the others are blind or weaker.
If you are starting from zero and cannot fund all three at once, evaluate in this order. First, check your untracked share: if offline, brand, sponsorship, or retail activity carries more than roughly 20% of your budget, MMM comes first, because nothing else can see that spend. Second, check your decision cadence: if the decisions that matter are weekly and in-platform, stand up attribution as the tactical layer. Third, check your data history: MMM wants two years or more of consistent aggregate data, so if you do not have it, start collecting now and run experiments in the meantime. Fourth, check for one large contested channel: a single geo experiment on that channel buys more credibility than a dashboard ever will, and its result calibrates the model you build later.
What happened when a streaming service let attribution grade brand spend
In MASS Analytics’ work with a major global streaming service, its first three years of measurement ran on an attribution-dominated function. Roughly 90% of acquisition spend flowed through digital channels the attribution model could read, brand campaigns were credited at close to zero, and the attribution-driven case for cutting them was building.
We then ran an MMM alongside a geo-lift experiment on the brand campaign. Our combined reading found brand investment was driving approximately 28% of trial signups, against an attribution measurement of essentially zero. As a result, the plan rebalanced: digital’s share of acquisition spend moved from 90% to 65%, and acquisition cost improved by 11% in the first full year under our integrated reading. This is what geo experiments are for: settling exactly this kind of contested call with causal evidence.
MASS Analytics’ MMM and geo-lift analysis found a brand channel attribution credited at close to zero was driving approximately 28% of trial signups. Correcting the reading improved acquisition cost by 11%.
A routing rule that settles the debate
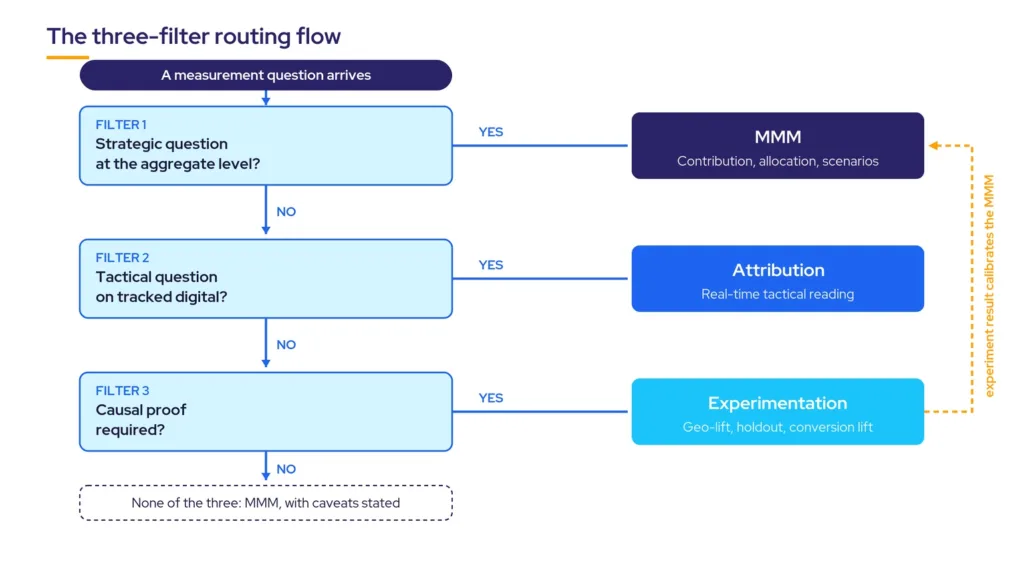
When a measurement question lands on your desk, run it through three filters in order.
Filter one: is it a strategic question at the aggregate level? Total budget defense, cross-channel allocation, scenario planning, budget optimization. If yes, MMM owns it.
Filter two: is it a tactical question on tracked digital? Which creative variant converts better, which audience segment responds, whether to shift spend two days into a live campaign. If yes, attribution owns it.
Filter three: does the decision require causal proof? When the stakes are large and the answer is contested, commission an incrementality test and calibrate the MMM with the experimental result. Experiments are expensive and slow, so they earn their place by being deployed selectively, where causal certainty is what the decision requires.
Route the question, not the loyalty. Strategic and aggregate goes to MMM. Tactical on tracked digital goes to attribution. Contested and causal goes to an experiment.
Run all three on one evidence base
The integrated architecture is not three methods running in parallel by accident, each producing its own contradictory number in its own dashboard. It is three instruments deliberately deployed, with disagreements surfaced as questions to resolve rather than hidden as contradictions. Specifically, the MMM provides the strategic decomposition. The experimental layer provides causal anchors for the channels that have been tested. The attribution feed provides digital granularity where it adds clarity and is excluded where it does not.
We designed MassTer PACE around exactly this principle, because clients kept arriving with three workstreams and three answers. In addition, one evidence base changes what the outputs are worth: response curves and marginal ROI from a calibrated model are numbers a CFO will act on, not numbers a CFO will argue with.
So the question to carry into your next budget meeting is not which measurement method is right. It is this: which lines in the plan are funded because the measurement can see them, and which are starved because it cannot? If nobody in the room can answer, the fight worth having is not MMM vs. MTA. It is visibility vs. comfort.
Frequently asked questions
Marketing mix modeling is a statistical technique that reads the relationship between aggregate marketing investment and business outcomes such as sales or signups. It measures every channel, online and offline, tracked or untracked, over weeks to years, and produces channel contributions, ROI estimates, and budget optimization scenarios without using any personal or user-level data.
Multi-touch attribution is a user-level measurement method that follows an individual customer’s digital path to conversion and assigns fractional credit to each tracked touchpoint. Different rules, including first touch, last touch, linear, and time decay, split the credit differently. It refreshes within hours but covers only digitally tracked activity, and the credit it assigns is correlational rather than causal.
Both, if your channel mix justifies it. Use MMM for strategic questions: defending the total budget, allocating across channels, and planning scenarios. Use attribution for tactical questions on tracked digital channels: creative rotation, audience response, in-flight adjustment. The methods answer different questions, so replacing one with the other leaves part of your marketing unmeasured.
Less than it was. App Tracking Transparency, browser cookie restrictions, and platform walled gardens removed much of the user-level signal attribution depends on, so its coverage has narrowed and its journeys have gaps. It remains useful for directional tactical reading inside tracked platforms, provided the credit it assigns is treated as correlational evidence rather than causal proof.
No. MMM runs on aggregate time series data: weekly spend or impressions per channel, sales or conversions, pricing, promotions, and seasonality. That is why privacy regulation and cookie deprecation do not affect it. The practical requirement is history rather than granularity, with two years or more of consistent aggregate data as the usual threshold.
Expect disagreement, because the two methods measure different things over different horizons and coverage. Treat the gap as information: it usually marks activity attribution cannot see or credit attribution is over-assigning to lower-funnel touchpoints. When the decision at stake is large, run an incrementality experiment as the arbiter and calibrate the MMM with the result.
Key takeaways
- • Attribution’s blind spot is structural, not a data quality problem: activity that generates no trackable touchpoint is invisible to it and accumulates as unclaimed organic conversion.
- • MMM vs. MTA is a category error. MMM reads the strategic outcome at the aggregate level; attribution reads the tactical journey at the user level.
- • Evaluated across six dimensions (granularity, horizon, coverage, evidence, data requirement, privacy exposure), each method wins rows the others cannot.
- • Privacy regulation demoted attribution from sole arbiter to one instrument among three, and MMM’s resurgence follows directly from needing no user-level data at all.
- • Route questions instead of picking sides: strategic and aggregate goes to MMM, tactical on tracked digital goes to attribution, contested and causal goes to an experiment.