Explore
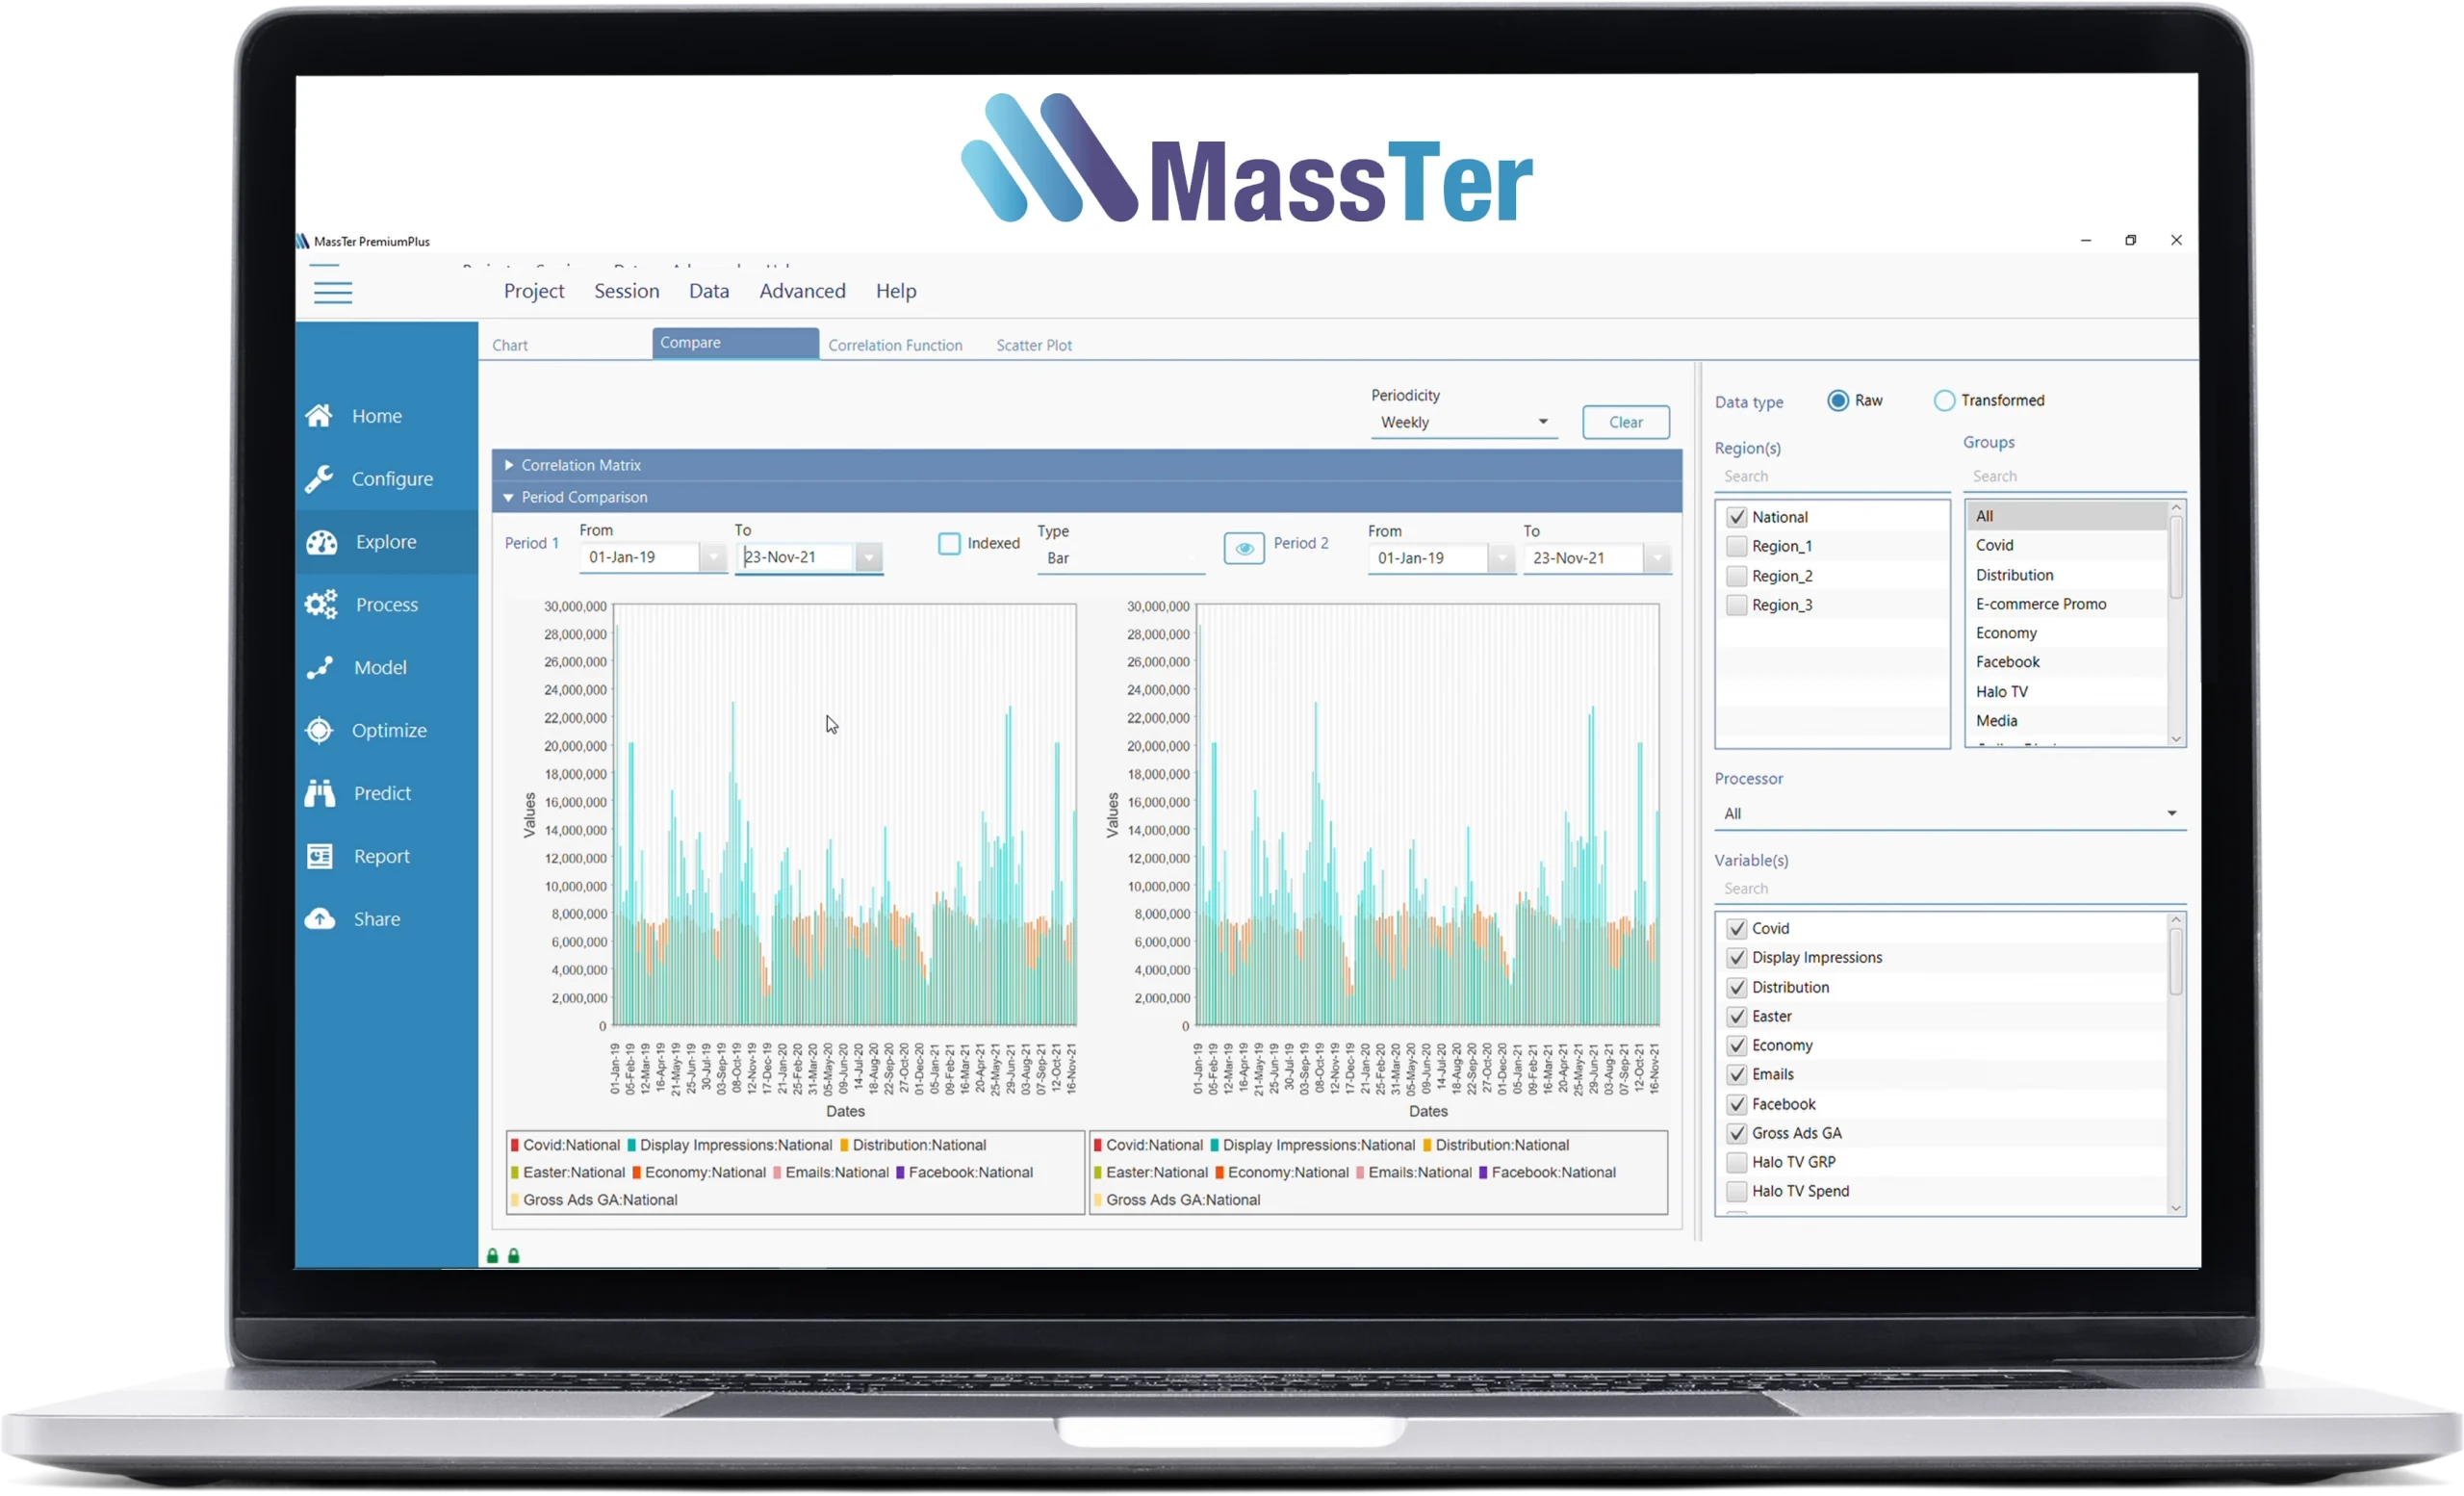
The “Explore” module allows you to display and chart variables, analyze different data cuts, understand the relationship between the input variables and build hypothesis to be tested in the models.

Explore Features
✓ Easy-to-use charting interface
✓ Discover and understand your data
✓ Build hypotheses to be tested and validated in the modeling phase
✓ Key basic statistics: Sum, Mean, Standard deviation, quartiles, etc.
✓Key advanced measures: Correlation Matrix, Correlation Function Compare Periods, Scatter Plots, etc.


