Data Exploration in Marketing Mix Modeling: Where Data Starts Telling a Story
Data Exploration in Marketing Mix Modeling: Where Data Starts Telling a Story
This blog is the fourth of a series of articles that will introduce our readers to Marketing Mix Modeling (MMM), a proven marketing and ROI measurement technique.
MMM has stood the test of time and is today leading the way of highly granular and privacy compliant marketing measurement techniques.
In today’s digital world, data has become a valuable commodity for businesses of all sizes. But harnessing its power at full potential is still a struggle for many companies. This difficulty comes from its size and complexity. In the previous article from this series, we detailed the types of data that analysts could need in a MMM project. In this article, we dive into one of the most pivotal steps in a MMM project: Data Exploration.
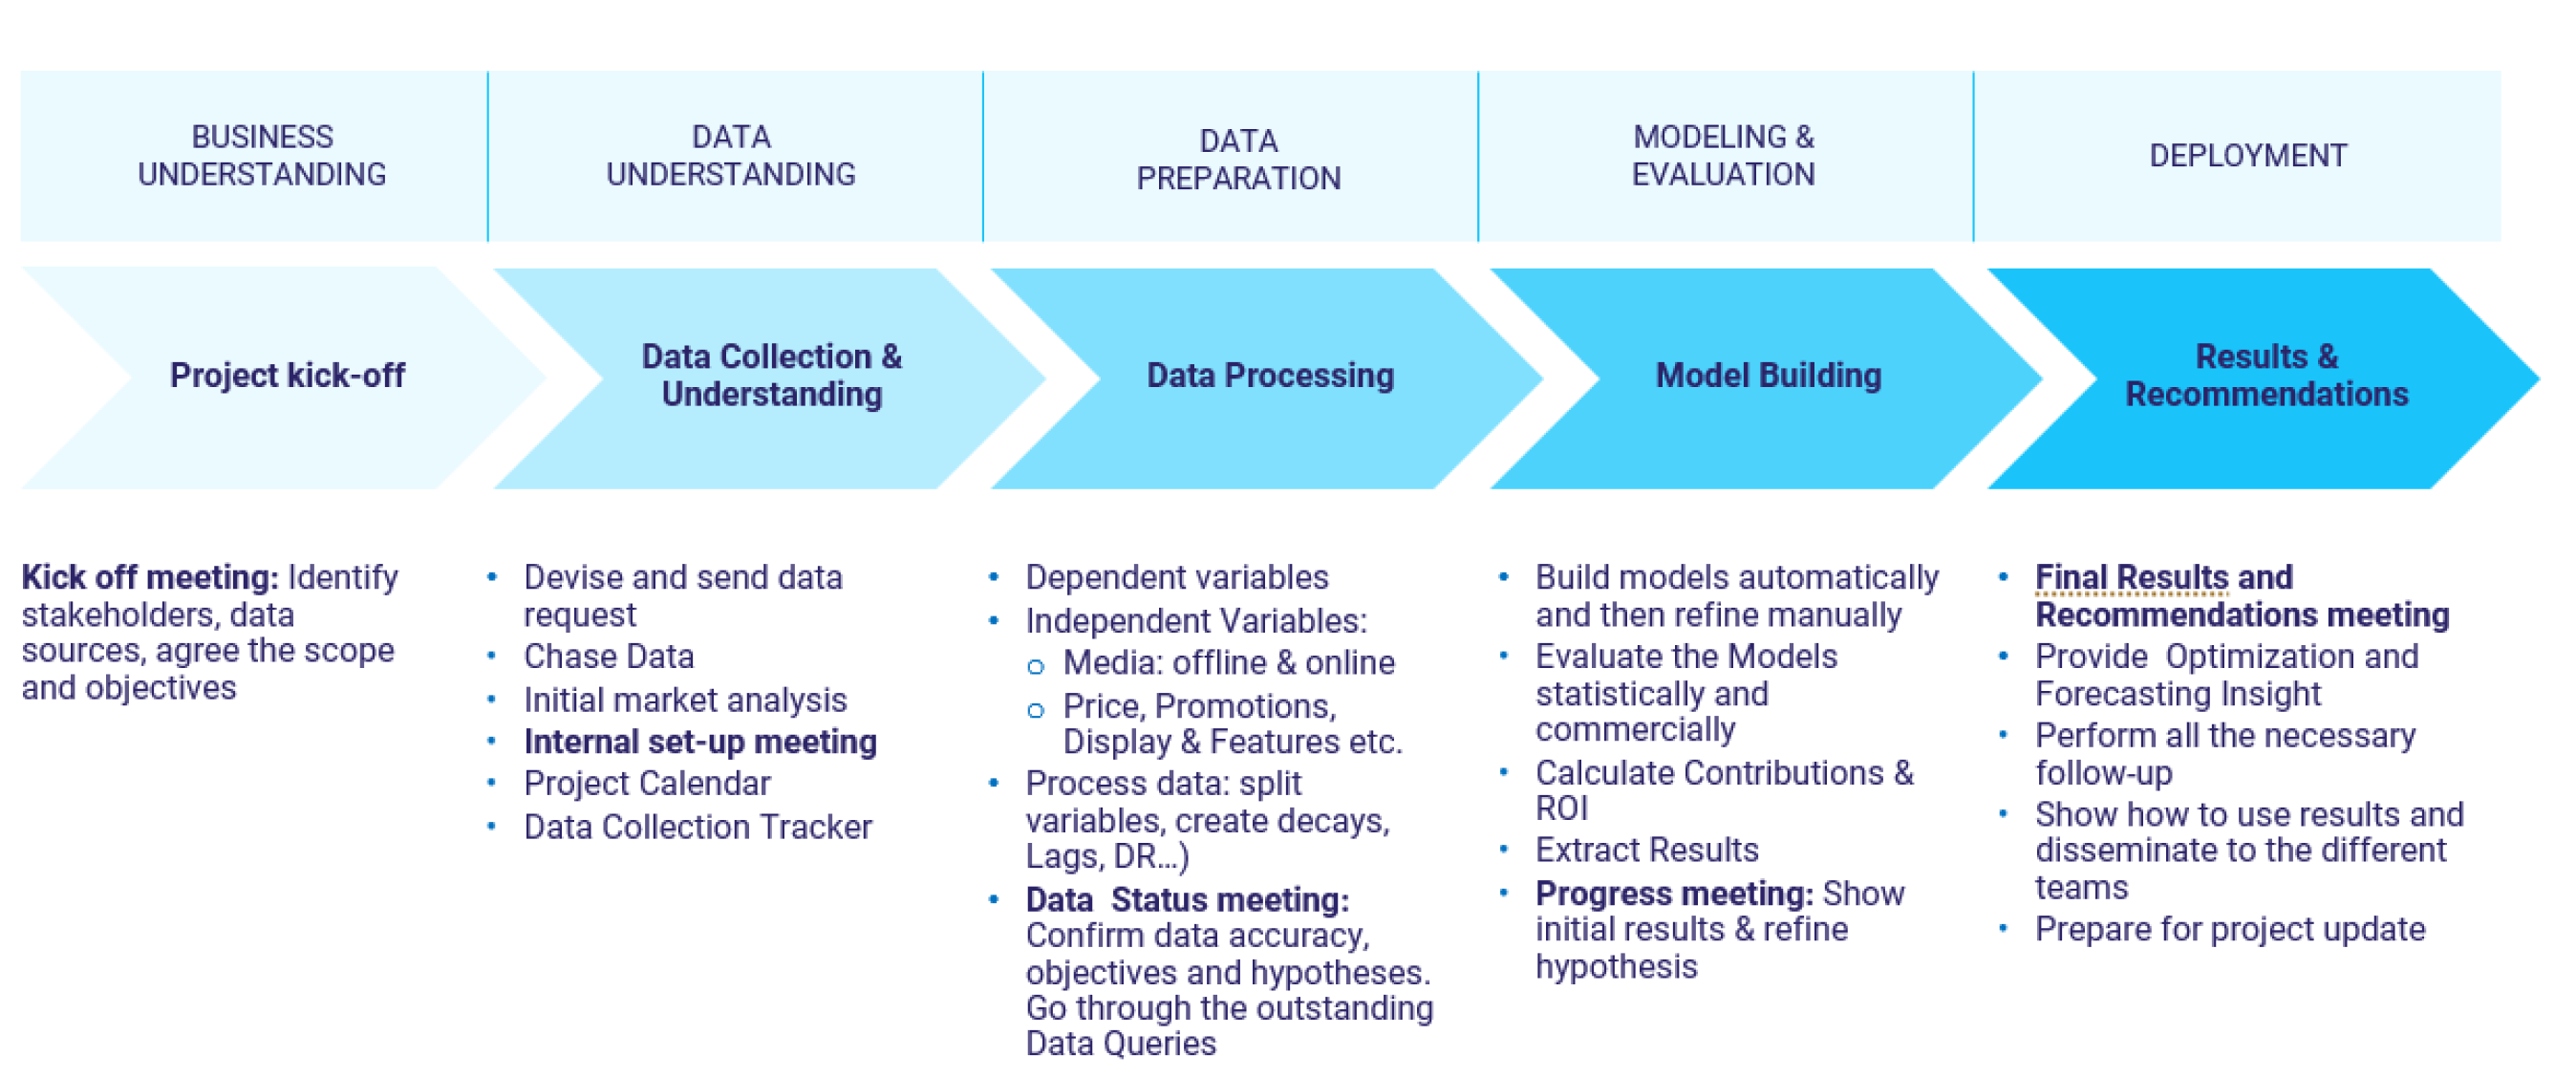
This step is at phase two of the standard marketing mix modeling workflow.

It is also called data Validation and is one of the most important steps in the execution of a marketing mix modeling project. An ample amount of time needs to be spent in thoroughly analyzing and charting the data provided to understand it well. Data Exploration is also important because it is the phase where the analyst needs to think about what transformations to apply to the variables in the next stage, which is Processing.
In Data Exploration, charting is the most important element. The analyst must take time to chart the data by period, also by cross-section, or region, if data is available at this level. The following are some examples of charts that we recommend, and some statistics we believe should be computed:
For every variable, the analyst should consider univariate data analysis (univariate analysis) like:
-
-
- The mean of the variable.
- The standard diviation.
- The quartiles.
-
→ This will help them get an understanding of the distribution of the variables that they have.
They should chart the independent variables (marketing and media variables) against their modeled KPIs, e.g. sales, as that would give them an idea about whether the variations on one variable are influencing the variations of their KPI.
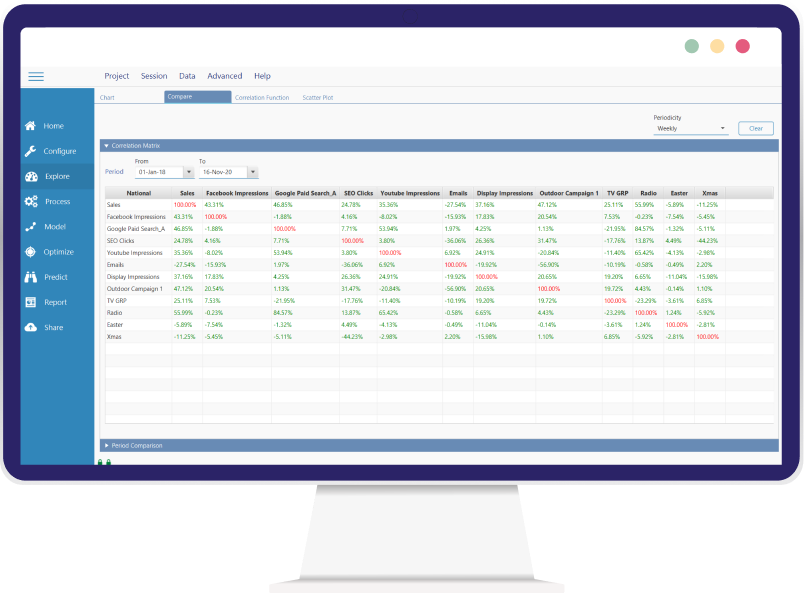
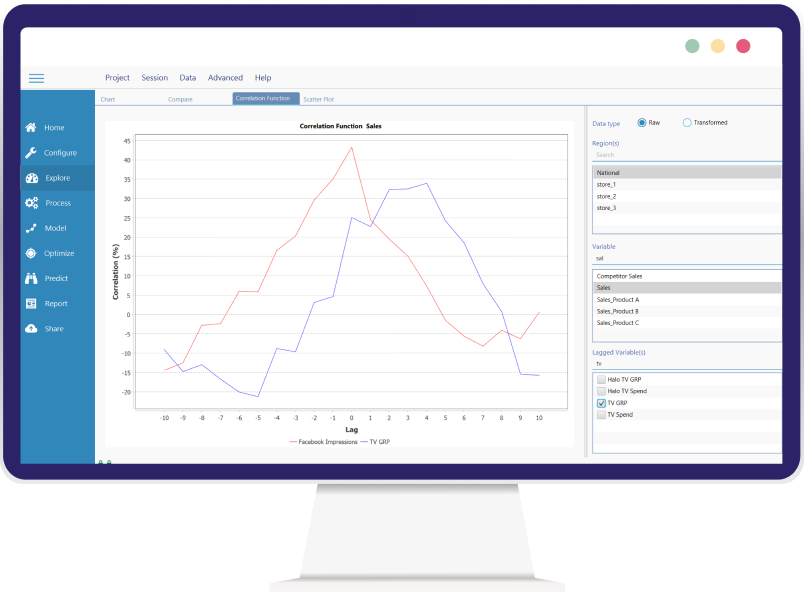
- The correlation matrix is another key element of this phase as it describes the strength of the linear realtionship between two variables. The analyst can also use the correlation function which is useful to study the lagged effect of a avariable on a chosen KPI. As a matter of fact and in the specific context of marketing mix modeling, there is usually a delay in the response to certain marketing activities. Thus, if the analyst lags the independent marketing variable, they can see better the correlation between that variable and the KPI that they are modeling.


Correlation Matrix in MassTer
With our Marketing Mix Modeling Tool, MassTer, you can easily display the correlation matrix for a selection of regions or variables
- The scatter plot is used when the analyst wants to understand the trend of a variable against, for example, the dependent variable, to discover whether there is some kind of strong correlation between the variables that they are analyzing.
Data Exploration is the stage at which the analyst lays the ground for their data to start telling the story behind the raw numbers. Therefore, they should spend the necessary amount of time to chart their data so that when they move to Data Processing, they can successfully apply their transformations.


This section allows you to chart the cross-correlation function between two variables while automatically applying multiple lags on one of the variables selected. (e.g. you can chart the correlation between Sales and TV GRP lagged).
Since this is a dedicated MMM software, it gives you the option, in other modules, to apply this lag transformation on variables in order to capture the highest correlation (highest effect in this example) of these variables.
In the next article, we will take you through a rich set of processors that allow the analyst to shape their data in a way that mimics real life and thus start making sense from the business perspective.


