
MASS Analytics shows that a model that leaves out pricing and promotion analytics doesn’t remove a promotion’s effect. It hands the credit to whatever media happened to run alongside it.
- →What promotion performance analysis measures, and why a media-only model misses it
- →How to separate base sales from the incremental lift a promotion creates
- →Why price elasticity, not instinct, should decide whether a discount pays for itself
- →How the same modeling logic that reveals a halo effect also reveals cannibalization between your own product lines
- →What a model needs as inputs to measure promotions properly
Media-only models overstate media ROI when promotions are left out
Most marketing mix models leave promotions out completely. Or they lump promotions into one broad variable with everything else. The effect is easy to predict. The model hands whatever sales lift a promotion drove to the media that ran alongside it. So media ROI looks better than it really is, and the promotion looks almost free. In categories where promotion and discount spend rivals or beats media spend, that is not a small error. It changes which budget conversation happens next. Because of this, pricing and promotion analytics belongs inside the model, not next to it.
The model hands whatever sales lift a promotion drove to the media that ran alongside it.
What promotion performance analysis measures
In short, a model that includes promotions answers one clear question. How much of the sales lift during a promotion came from the promotion itself, not from what would have sold anyway, and not from whatever media ran at the same time? In other words, marketing mix models should treat pricing and promotions the same way they treat media: as controllable factors, not as noise to average away.
MASS Analytics sees this pattern across retail and CPG work. For example, for Kellogg’s, this meant asking a direct question about one of their leading brands: what does promotional activity contribute once the model holds media’s effect constant? Read the full case study. Promotional and discount spend is rarely small enough to skip measuring. This is true whether the spend flows through price and discount deals, or through catalog and leaflet advertising. Either way, both create the same measurement problem, just through a different channel.
This builds on the same ground as Marketing Mix Modeling 101. Pricing and promotions are one of the controllable factor groups a model must account for, not an edge case.
Separating base sales from a promotion’s incremental lift
Every sales number during a promotion actually combines two numbers. One is the base: what would have sold with no promotion running at all. The other is the incremental lift the promotion added. In most categories MASS Analytics models, base activity makes up somewhere between half and two thirds of total sales. However, if a model skips that incremental part, the credit does not disappear. Instead, it lands on whichever variable moves most closely with the promotion’s timing. Usually that is media, when the promotion runs alongside a campaign. Sometimes it is base or seasonality, when the promotion follows a fixed yearly cycle. Either way, something else picks up credit for what the promotion actually did.
The same logic that separates media’s contribution from base sales also applies to promotions. To measure contribution, the model needs a reference point: what sales would have looked like if the promotion had never run. The model must define and disclose that reference point, not simply assume it.
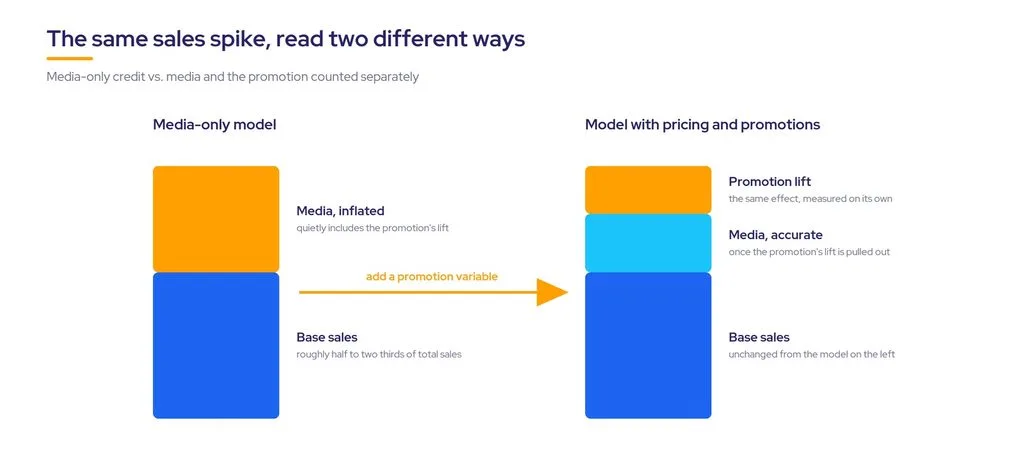
In most categories MASS Analytics models, base activity accounts for somewhere between half and two thirds of total sales.
Price elasticity determines whether a discount pays for itself
Price elasticity is simply how much volume responds to a change in price. Commercially, one distinction matters most. For example, does a discount grow total category volume? Or does it just pull forward purchases a customer would have made anyway, days or weeks later at full price? Either way, only the first kind is worth repeating.
So when a price elasticity estimate looks implausible against published category norms, treat it as a warning sign. The model needs a second look, not blind acceptance just because it came out of a regression. After all, statistically significant is not the same as commercially believable.
Cannibalization moves volume, it does not create it
A promotion on one product can pull share from another line in the same portfolio, instead of growing total demand. In fact, this is the same modeling logic as a halo effect, just running in the opposite direction. For example, MASS Analytics has measured this kind of spillover directly. In one engagement, MASS Analytics linked a CPG brand’s retailer-level models, so each retailer’s media sat inside the other retailer’s model too. As a result, one retailer’s onsite media turned out to lift a competing retailer’s revenue by 12 percent. That is a real halo effect, and neither retailer’s own numbers would have shown it alone. Read the full case study. Similarly, the same logic runs in reverse for cannibalization between a company’s own product lines. So it is just as easy to miss, if nobody actually looks for it.

One retailer’s onsite media turned out to lift a competing retailer’s revenue by 12 percent.
Retail and CPG categories feel this gap first
In one MASS Analytics engagement, a B2B software company ran 40 models across 8 countries and 5 products. In Japan specifically, promotions drove most of the sales. Each other market ran on a different driver. So a single global allocation rule would have misjudged Japan’s mix.
Retail and CPG categories usually face this problem at a finer level still. For instance, multiple banners, individual stores, and sometimes a wholesale layer sit between the brand and the end customer. Because of this, the same structural discipline separates a store’s performance from its banner’s, and a banner’s from the parent company’s. This discipline is also what makes it possible to separate a promotion’s contribution from media’s. The finer the level a model can run at, the more precisely it can attribute either one. Getting Started with Marketing Mix Modeling: Multi-Banner, Store-Level, Wholesale covers how that structural logic adapts across retail formats. Hierarchical Modeling in MMM covers the pooled regression technique behind it. This same measurement discipline sits behind Marketing Mix Modeling for Retail more broadly.
What a model needs as inputs to get this right
Measuring promotions properly starts with the data you feed the model. That means pricing history and the promotional calendar: discount depth, mechanic, and duration. It also means distribution and display support, wherever a team tracks that data. All of this sits alongside the media and external variables that most models already include.
Also, diminishing returns apply here too. A response curve flattens for media spend past a certain point. Similarly, the same holds for discount depth: a deeper discount does not keep buying proportionally more volume forever. Marketing ROI Analysis: Response Curves and Synergy covers how MASS Analytics reads that curve for media. The mechanism for promotional depth works the same way. So once a model measures pricing and promotions on the same footing as media, the natural next step is combining all three. Feed them into marketing mix optimization, instead of optimizing media spend alone. See the Comprehensive MMM Guide for the full methodology behind that step.
Once a model measures pricing and promotions on the same footing as media, the natural next step is combining all three.
Media-only model vs. a model with pricing and promotion analytics
| Media-only model | Model with pricing and promotion analyticsRecommended | |
|---|---|---|
| Media ROI reading | Inflated, absorbs promotional lift | Attributed correctly to media alone |
| Promotional spend visibility | Effectively invisible | Measured against its own reference point |
| Base vs. incremental split | Not separated | Explicit, disclosed reference point |
| Cross-line cannibalization | Invisible | Detectable using the same logic as halo effects |
| Verdict | Choose only when promotional and discount spend is genuinely negligible in the category | Choose whenever promotional and discount spend is a meaningful share of the budget |
A model that leaves promotions out doesn’t remove their effect. It just hands credit to whatever media happened to run alongside them.
The question for the next budget review
So before the next budget review, the question worth asking is not whether media is working. It’s whether anyone ever built the model to tell media’s effect apart from the promotion running next to it.
Frequently Asked Questions
It is the part of a model that isolates how much of a sales lift came from the promotion itself. That is separate from base demand, and separate from media running in the same window. Without it, the model folds promotional lift into whichever media variable happened to be active. As a result, this overstates that channel’s return.
Base sales are what would have sold with no promotion or marketing activity running at all. Incremental sales are the lift a specific promotion, campaign, or price change added on top of that base. A model has to separate the two, using a defined and disclosed reference point, before either number is meaningful.
Price elasticity measures how much sales volume changes in response to a price change. For a promotion, the practical question is simple. Does a discount grow total category volume? Or does it simply move purchases a customer would have made anyway to an earlier date? Only the first case adds real value.
Yes. The same modeling logic applies to both directions. In other words, a positive halo effect is one product’s promotion lifting sales of another. Meanwhile, the negative version is a promotion pulling share from a related line, instead of growing total demand. Either way, the model measures both against the same reference point logic.
A model needs pricing history and the promotional calendar: discount depth, mechanic, and duration. It also needs distribution or display support, wherever a team tracks that data. All of this sits alongside the media and external variables a team already uses to model the rest of the business.
No. A marketing mix model that properly includes pricing and promotion analytics still holds standalone authority over strategic, mix-level decisions. Instead, incrementality testing and attribution remain useful as enhancements, for calibrating specific estimates, not as a substitute for the model itself.
- ✓A model that leaves out pricing and promotion analytics does not remove a promotion’s effect. It reassigns the credit to whatever media ran alongside it.
- ✓A model has to separate base and incremental sales before either a media or a promotional ROI number means anything.
- ✓A price elasticity estimate that looks implausible against category norms is a validation failure, not a result to accept at face value.
- ✓A model measures cross-line cannibalization with the same logic it uses for a halo effect, just running in the opposite direction.
- ✓Where promotional and discount spend rivals or exceeds media spend, this is not a modeling nicety. It changes which budget conversation happens next.