Keep an Eye on ROI:
Return on Investment in Marketing Mix Modeling

In the previous article of this series, we learned how to measure the contribution of each channel in an MMM project. In this article, we will explore an equally important concept, Return on Investment, and understand how it’s connected with Contribution.
One of the key concepts in Marketing Mix Modeling is the relationship between ROI and Contribution.
Because of diminishing returns, as the contribution increases, and the more the business spends on a channel, the less marginal contribution it will generate. This translates into a decreasing ROI.
Because of this dilemma, the MMM analyst must ensure that they achieve consistent and sustainable contribution while keeping an eye on the level of ROI.
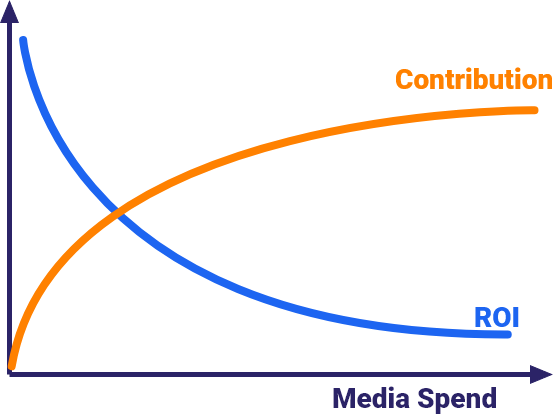
The objective is to Maximize Contribution while keeping a profitable ROI
How do you do that? Let’s find out!
What is ROI?
Marketing Return on Investment (MROI, ROMI, or just ROI) is used to measure the efficiency of a specific media or marketing activity. It could also be used to compare the efficiency between different media or marketing activities. The basic equation is as follows:
Remember, the numerator and the denominator of that ratio should be expressed in terms of value.
ROI = Revenue / Spend
Nominator
(Expressed in Value)
Denominator
(Expressed in Value)
Marketing ROI in Practice:
An Example
Say we are doing an MMM project for a cereals brand. We want to model their volume sales (quantity of the product that was sold) as opposed to value sales (their total value in dollars.)
We will use variables like promotions, investment in media, seasonality, and distribution to explain the variations in the volumes. To compute the contribution of, for example, investment in media, we will be multiplying the coefficient (as estimated by the equation) by the level of activity in media.
This will help us compute the incremental contribution, but because sales are expressed in terms of volume, the incremental contribution will also be expressed in terms of volume. This should not be the case, because, in ROI, it is fundamental that the numerator and the denominator are expressed in terms of value.
Nominator
(Expressed in Value)
Denominator
(Expressed in Value)
One solution to this is to divide that volume incremental by the price of the product to obtain the value incremental, which is the component that would feature in the numerator of the ROI. On the other hand, if media investment consists of Display, which was modeled through impressions, what should be kept in mind is that impressions are not expressed in value.
Thus, it is very important that for the denominator, we translate impressions into spend:
Number of
Impressions
x
Average cost of
an impression
Now that the total cost of the display activity is obtained, it can be used to divide the revenue incremental and obtain the ROI.
Once this step is done, the different ROIs across the board can be compared.
A Note on Diminishing Returns Curves!
Let’s say you run a project and you want to report on your diminishing returns curves.
But then you refresh the data, and you update the model. It is possible to obtain a different diminishing returns curve!
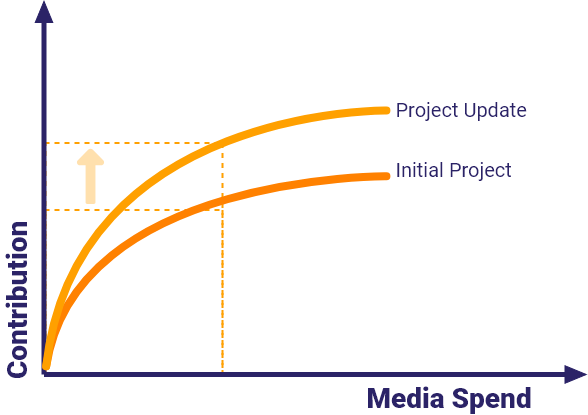
Example:
When we updated the project the same media spend generated higher contribution thanks to the creative change
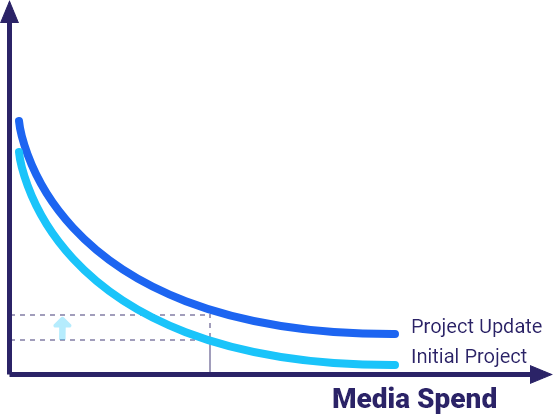
This means that the ROI curve has improved and we could obtain better ROI when media spend increases compared to the initial project
This could be explained by the fact that for a specific media channel, there has been an improvement in the spot length mix, in the laydown, or even the creative.
In this context, the diminishing returns curve will improve. So, it will take an upward trajectory as compared to the initial project. Similarly, the ROI curve will also be improving.
Thus, in certain contexts where execution level entities or details change, it could translate into better performance, and better contribution, consequently, an improved ROI. When this is the case, you could end up with an ROI that has improved even with increased spend.

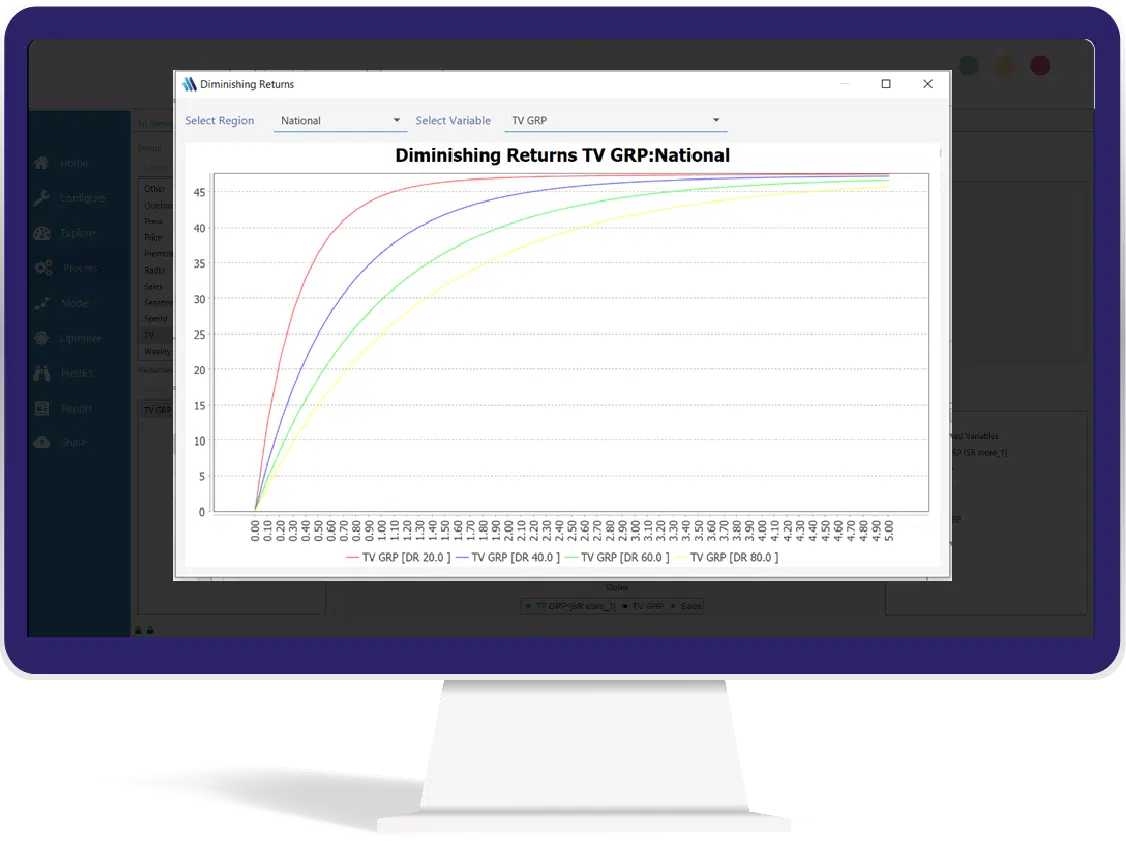
Diminishing Return Curves
MassTer provides you with the option to build your DR curves by using either the S or the C-shaped curve. All you need to do is assess your needs and apply Diminishing Returns to the selected data series using one of the 2 predefined functions: Exponential & Adbudg.
The Adbudg function has two parameters:
- Gamma (generally set to 1 to get
a C-shaped curve and above 1 for
S-shaped curves) - Rho or saturation factor
Conclusion
Getting your ROI right is crucial as it will determine how much additional savings or profits your marketing mix modeling project will result in!
So, give it as much time as it needs.
On the next part of our series, we will cover the different modeling techniques you can use in MMM, see you there!


