Marketing Mix Optimization: The Science-Backed Approach to Get the Most Out of Your Marketing
In most companies, marketing budgets are decided on in one of the following ways:
- As percentage of revenue or profit
- Incremental adjustments of previous budgets based on performance/goals
- Basing the amount on how much competitors are spending
- Zero-based budgeting: starting from zero and justifying every expense
The problem with these methods is that they don’t account for the effectiveness of different media channels, brands, their elasticities, and the diminishing returns that arise from more spending.
The result?
- Missing sales targets due to insufficient marketing spend
- Wasteful spending going to initiatives that have no impact
- Money left on the table that could have been used more effectively…
Fortunately, by leveraging analytical methods like marketing mix modeling (MMM), you can save your business from those scenarios. One of the ways MMM helps is through the optimization of marketing spending.. The idea behind it is to mathematically determine the budget allocation that will lead to the best outcome for your business, based on the historical performance of each channel.
In this guide, we explain how the optimization process works. We include real-life examples and references for further study.
What is Marketing Mix Optimization?
Marketing mix optimization is the process of determining the best marketing budget allocation given the objective and KPI you set.
Marketing mix optimization helps you answer questions like:
- What is the optimal total marketing budget to reach my target?
- What is the optimal budget allocation for each media channel?
- How do I maintain the same revenue with a reduced marketing budget?
How Does Marketing Mix Optimization Work?
Ultimately, marketing optimization is about the concept of diminishing returns.
The more you spend on a given channel, the less effective it will get be. That means the marginal return you get from each additional dollar spent will decrease until spending more has zero incremental effect. When it gets to that point, we say the channel has reached saturation.
To get the most optimal marketing, therefore, you need to identify channels/units that have reached saturation, and reallocate the excess budget to the channels that still have room for growth.
Response Curve Optimization
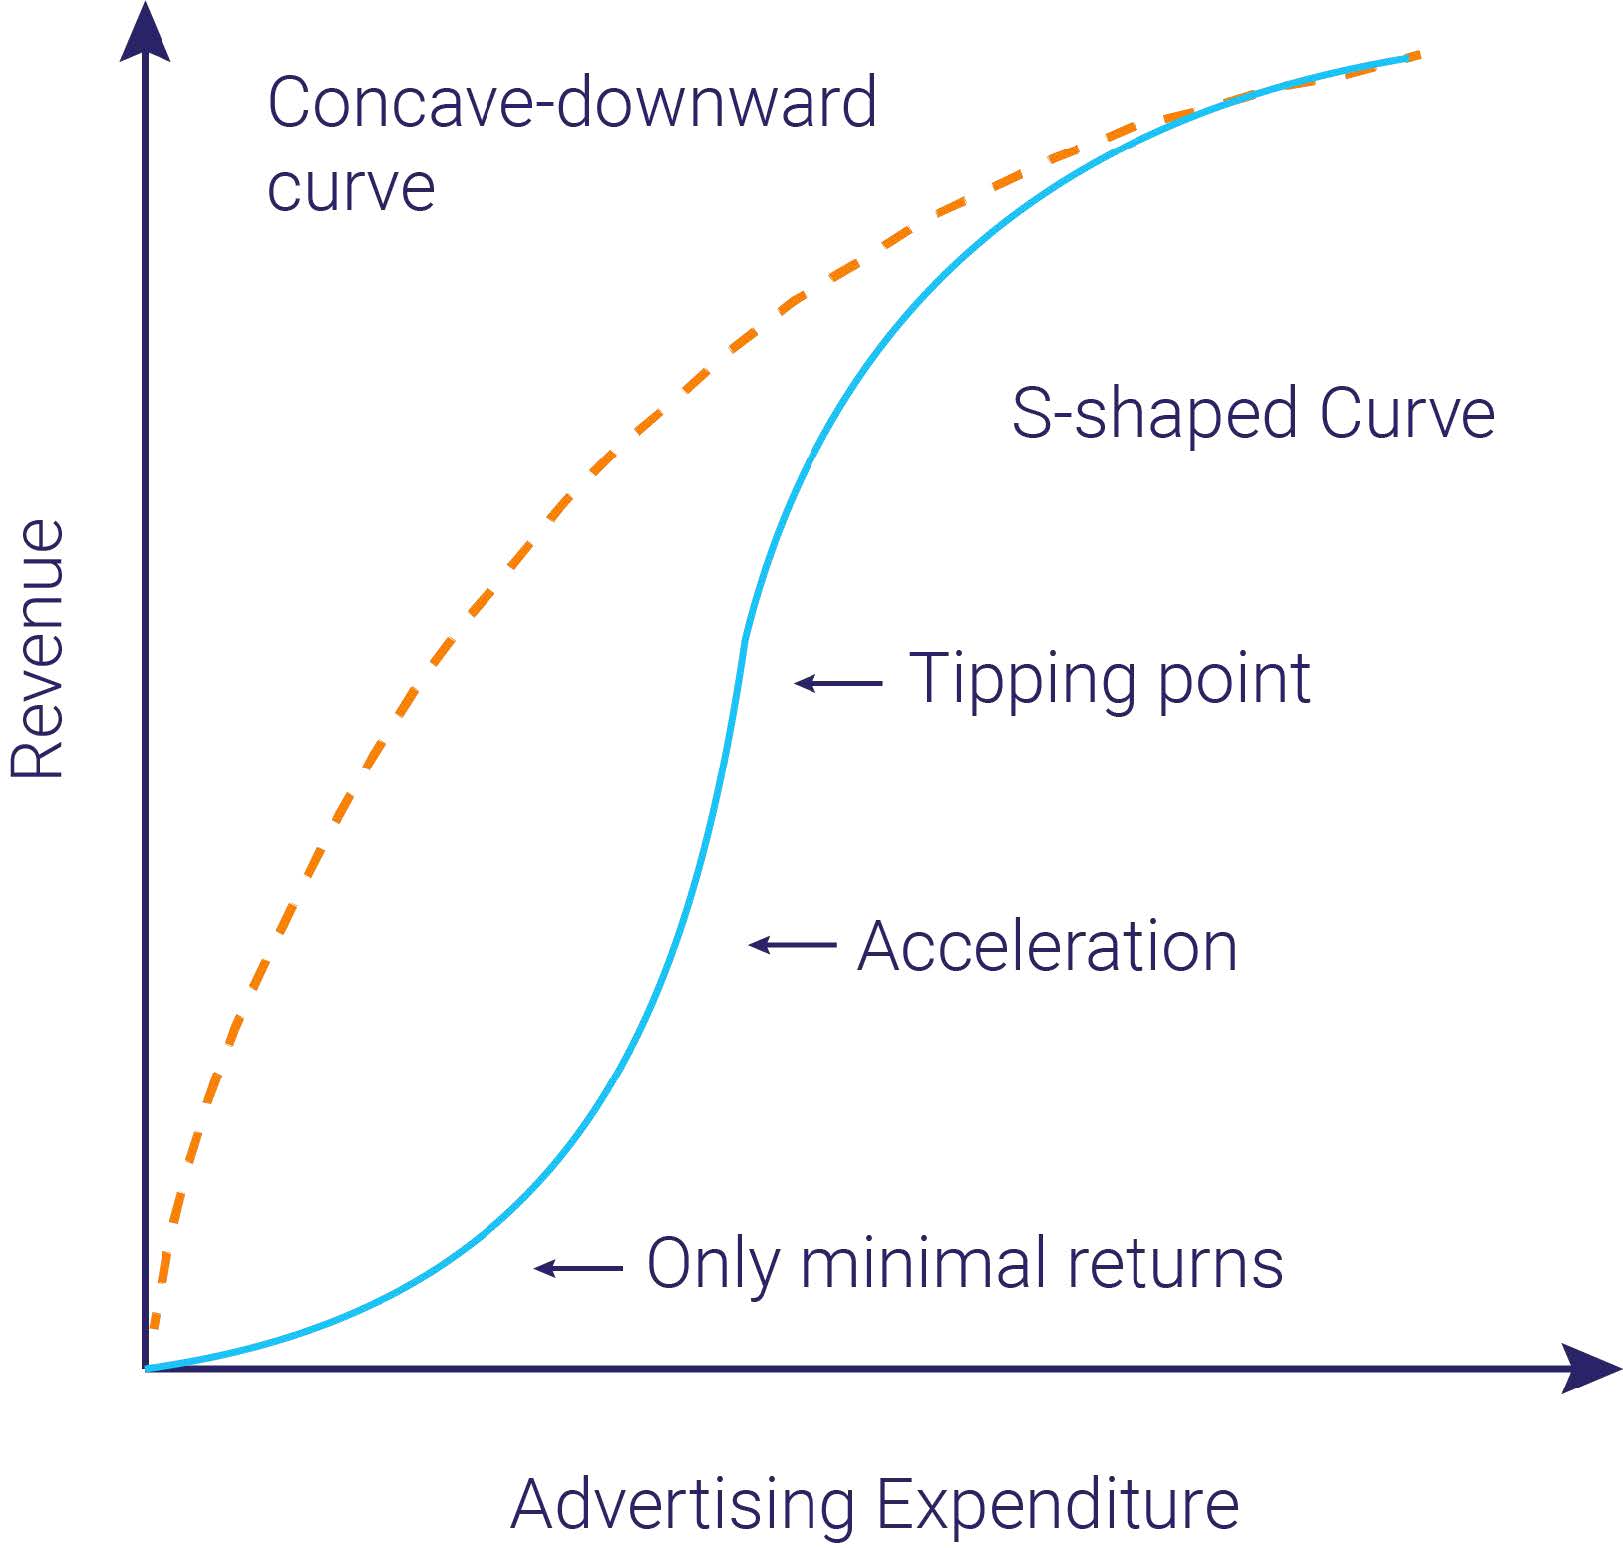
After the modeling step is complete, you will have your contributions by channel, and the diminishing returns’ returns curves for each. The curves are at the core of your optimization exercise.
There are two primary curve shapes that you will end up with: concave and S-shaped, as depicted in the graph below. Each shape signifies a distinct pattern of response between marketing mix elements and sales.

Different Approaches to Marketing Mix Optimization
Marketing mix optimization can happen at several levels of the organization. For instance, you can optimize the budget:
- For a single brand/product
- For a portfolio of brands
- At the country level
- At the business unit level
- At the product category level
A great resource to learn more about each approach is the book “Marketing Payback” by Robert Shaw and David Merrick, which covers the different techniques in more detail.
Marketing Mix Optimization Example: The Case of Bayer
In an award-winning Marketing Science paper, Fischer et al. (2011) collaborated with Bayer (the pharma and biotech giant) on a budget allocation solution for the company. The collaboration started in the 2005–2006 period and derived budget recommendations for 2007.
The authors built a marketing mix model covering Bayer’s primary care product portfolio. This included expenditures in six spending categories for 36 products, in 4 therapeutic areas and 5 countries. Then, through a novel optimization algorithm, they discovered they could achieve huge profit gains from a superior budget allocation. (Read the behind the scenes of optimization here)
In fact, the simulation suggested an increase in discounted profits of 55% over five years because of the optimized allocation. This was worth EUR493 million in additional profit!
This finding had a significant impact on the company’s marketing strategy. It also led to the creation of Bayer’s marketing intelligence unit. This goes to show the significant potential bottom-line gains that optimization offers.
Marketing Mix Optimization: Software & Tools
There are a variety of optimizers available in the market. Most open source MMM packages come with a basic optimizer. But one thing we noticed is that they lack essential features for an accurate optimization process.
At MASS Analytics, we have developed software solutions to make the optimization step easy. MassTer’s Optimize module does the trick; If you’re looking to optimize marketing spending for a single product, MassTer makes the process easy with the Optimize module!
For more advanced optimization, we use MassTer Insight, which is capable of optimizing for multiple products and markets simultaneously.
Further Reading
If you’re technically inclined and want to dig into the topic further, we included a selection of academic papers and talks for further study:
• Practice Prize Winner—Dynamic Marketing Budget Allocation Across Countries, Products, and Marketing Activities | Marketing Science (informs.org)
• Optimizable and implementable aggregate response modeling for marketing decision support – ScienceDirect
• Your Comprehensive Marketing Mix Modeling Guide
• A New Theorem for Optimizing the Advertising Budget | the Journal of Advertising Research
• Creating Optimal Marketing Budget Allocation: With and Without Data – MSI – Marketing Science Institute


