Data Splitting in
Marketing Mix Modeling
Data Splitting in
Marketing Mix Modeling

Data splitting is one of those transformations you can use when you want your MMM data to be more accurate and granular. It is key for better measurement.
Whether it’s applied to segments, regions, or variables, it helps you determine if a particular element, creative for example, has a more pronounced impact than another. This will translate into adding more variables into the model, and eventually make it more robust. In this article, we cover three processors you can use for data splitting in MassTer, MASS Analytics’ Marketing Mix Modeling software.

The Splitter Processor

This processor allows you to split a variable into multiple variables.
Let’s say for example your client is a bank that would like to measure the impact of their targeted campaigns on acquisition. They share with you their total paid ads data and a breakdown of their target segments: students, new employees, and established professionals.
What you need to do is use the splitter processor to divide your total paid search data into paid search by campaign audience. You’ll end up with multiple paid ads variables.
Once you get to Modeling, each campaign will have its own coefficient allowing you to measure the contribution and figure out which campaign is most effective for acquisition.

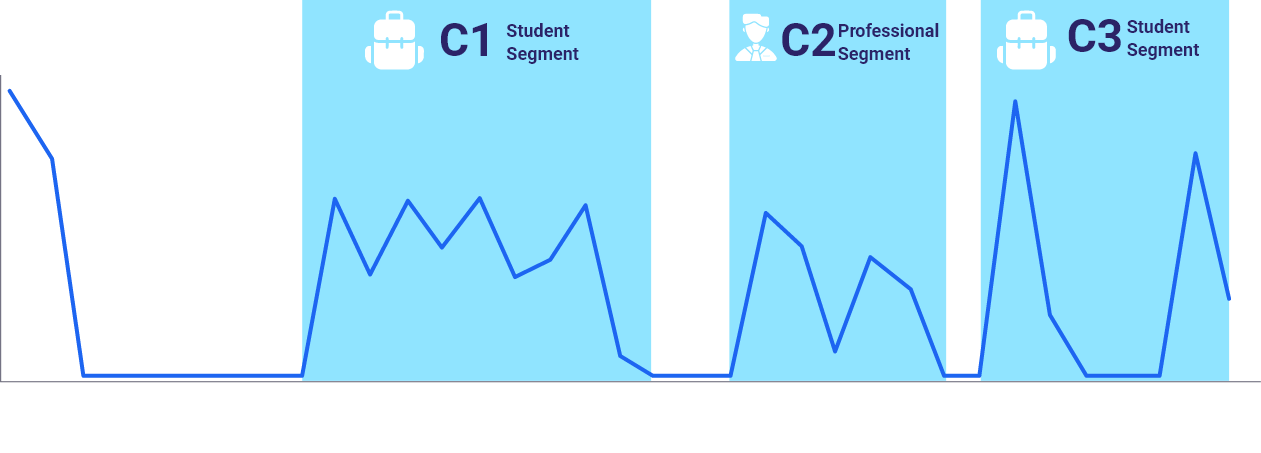
In the illustration below, we apply a Splitter to a total variable to create different campaigns. However, you could use different ways to split a variable. It could be by creative, day part, audience segment, format, spot length, etc. It really depends on the granularity you want to add to your measurement.
Paid Search Data Split Into Multi Campaigns

Tip: To know what splitting level you need to go down to, we recommend you pick the brain of the leadership/main stakeholders to understand what business questions they want the modeling to address.
Split Region

Split Region is generally used in the context of regional analysis or Pooled Regression.
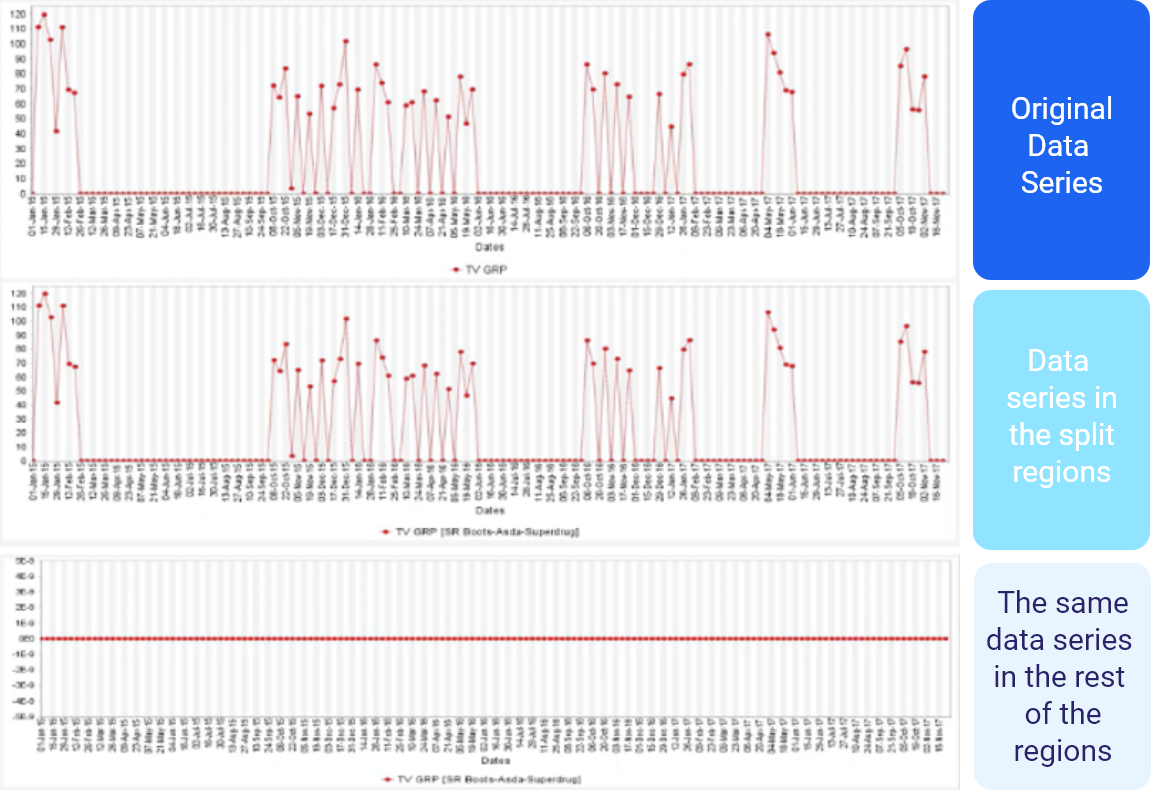
For example, we are pooling stores, geographical regions, or Designated Market Areas (DMA) in the states. And we suspect that some cross-sections of this data, like certain DMAs or stores, could have a different impact than the regional average.
In that context, what you would need to do is apply the Splitter processor or the Split Region processor to allow certain regions or DMAs to have different coefficients than the regional average.

When we use the Split Region processor, what technically happens is that we create additional variables.
For example, say we have a price variable that takes values across all the regions. But we suspect that in the northern region, the price sensitivity is different from the other regions è We may decide to split that region.
This means that we’ll be creating another variable that will have price values for the north region and will have zeros for all the other regions. When modeling, you can then measure the coefficient that depicts the sensitivity of the north region’s price variable.

Edit Processor
This processor consists of replacing some values in your original datasets by other values that would be more suitable to a particular context.
One example is customizing seasonality to fit your industry. If you create a seasonality variable and think that for specific periods you have particularly extreme values, you can use the edit processor to tweak it to your case.
Tip: Be careful when you use this processor because changing your data could sometimes be risky. You must always have a rationale behind the change.
In the chart below, you can see that we graphed sales data against the Christmas seasonality. We realized that in one of the years, we are missing Christmas. This meant that we needed to edit back the data to make sure that we account for the Christmas period during the analysis of the previous year. That’s when we used the edit processor!
⇒ We had a valid reason for using this processor: we know that Christmas happens every single year. Since it was missing in the original dataset, we needed to add it to be more accurate and closer to reality.

TIP: When splitting variables or dividing them by region, it’s essential to recognize that this action leads to the generation of additional variables. Always be aware of the degrees of freedom (available observations to estimate your coefficients) at your disposal to estimate your coefficients.
The greater the number of variables to estimate, the more degrees of freedom you’ll require.
Conclusion
Data splitting is vital for accurate and granular Marketing Mix Modeling (MMM). This article discusses three processors in MassTer for data splitting: Splitter, Split Region, and Edit. The Splitter processor divides variables into categories like campaigns, enabling different coefficients and better insights. Split Region allows region-specific coefficients, addressing regional variations. The Edit processor replaces values for corrections, ensuring precise analysis. Valid reasons are crucial when using data splitting techniques for reliable Marketing Mix Modeling results.


