
A perspective from MASS Analytics on how optimization turns a finished Marketing Mix Model into a budget decision, and the process that makes the results robust.
- →Where optimization sits in the MMM workflow, and why it only works once the model is trusted
- →Why the diminishing-returns curve, not a channel’s average ROI, is the real engine behind the allocation
- →Why the highest-ROI channel is often the wrong home for the next dollar
- →How a budget is actually allocated, one increment at a time, in a worked $50k walkthrough
- →The five-step process that keeps curves sensible, and the mistakes that undo it
Where optimization sits in the MMM workflow
Marketing Mix Modeling optimization is the step that turns a finished model’s measurement into a budget decision. The model tells you what happened; optimization tells you where the money should go next.
It sits in the deployment phase of the MMM workflow, after the model is built and trusted. If the model is not yet solid, the place to start is the modeling phase itself.
That order matters. Optimization only gives meaningful answers if the modeling underneath it was done properly. Weak curves produce confident answers that are wrong.
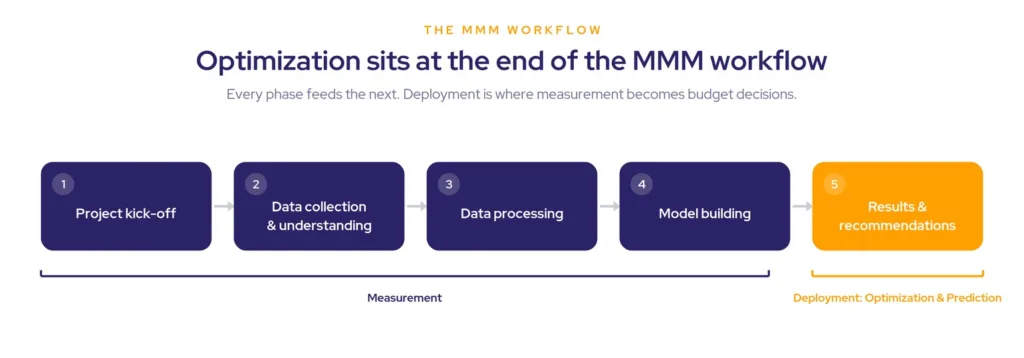
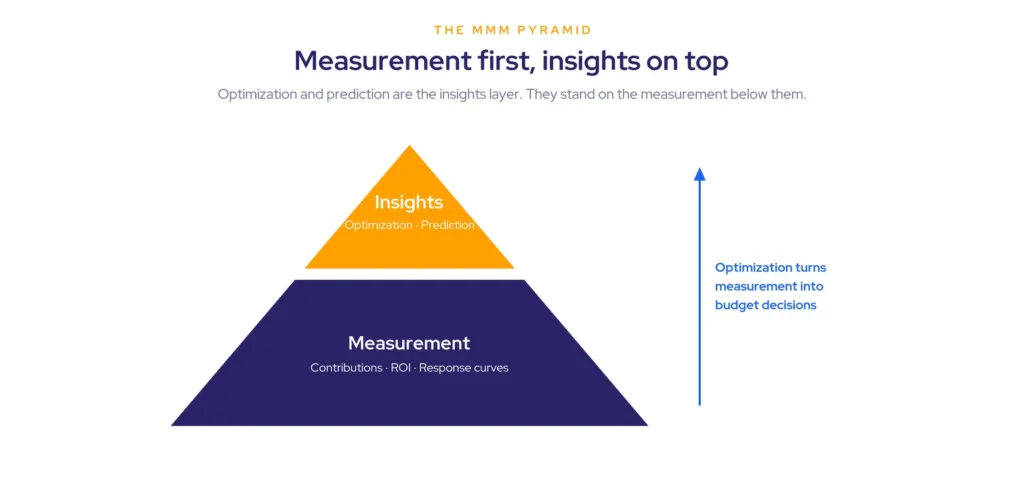
Within that final phase, optimization sits alongside prediction as the insights layer of the MMM pyramid. Everything below it is measurement: contributions, ROI, and the response curves and metrics the model produced. The insights layer is where that measurement starts paying for itself.
How optimization works
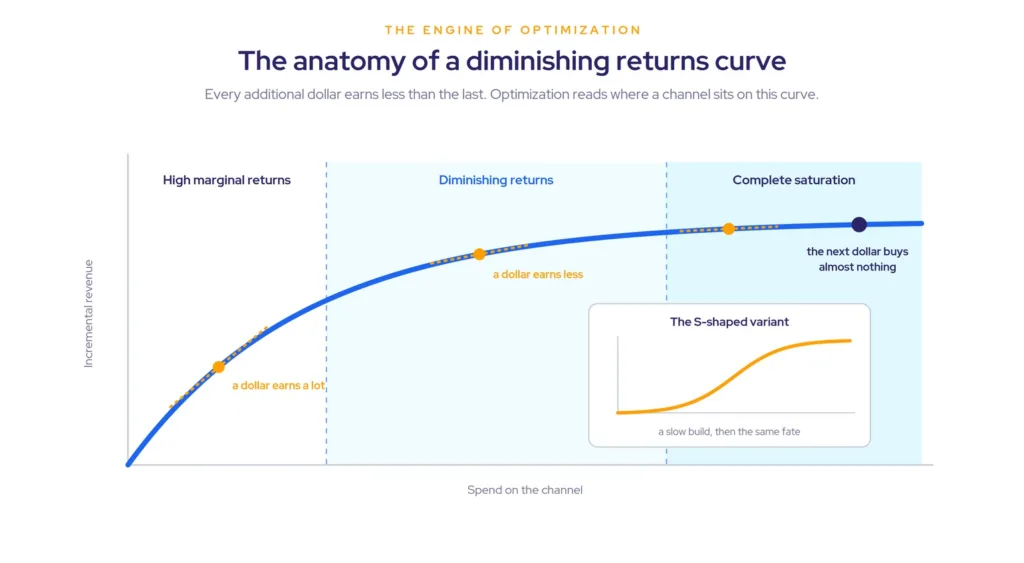
Optimization is based on the outputs of the diminishing returns curve.
The more a business spends on a channel, the more revenue it generally makes. But the marginal returns keep decreasing: as spend rises, each additional dollar earns less than the one before. This relationship is represented by a concave or an S-shaped curve.
Complete saturation is the point where the slope goes flat as the curve approaches its upper limit. An additional dollar spent on that channel buys almost no additional revenue, so the money belongs somewhere less saturated.
This is why ROI alone cannot decide the allocation. ROI is an average across everything a channel already spent; the allocation question runs on the margin, on what the next dollar will do. Deciding where the next dollar should go takes both the ROI and the saturation level of every curve.
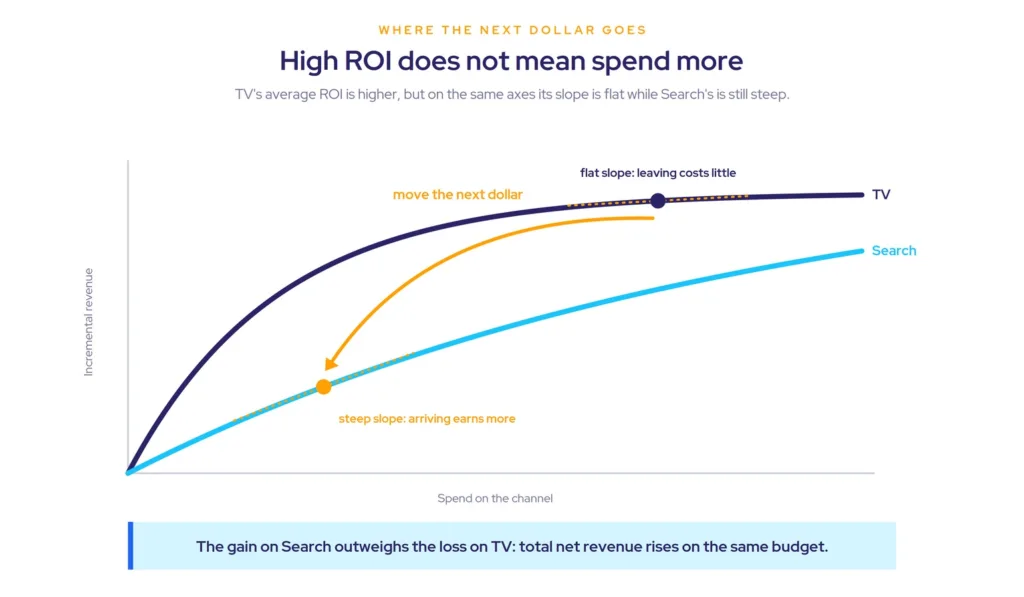
“ROI being high does not mean the business should invest more in that channel.”
Take two channels, TV and Search, where TV has the higher ROI but sits close to saturation. Moving a dollar from TV to Search produces two effects: a small decrease in TV’s contribution, because its slope is flat, and a larger increase in Search’s contribution, because Search is not as saturated.
The gain on Search outweighs the loss on TV. Same total budget, higher total net revenue. That mechanism is the whole of optimization; everything else is scale and constraints.
The optimization walkthrough: $50k across three channels
Say there is $50k to invest across three channels: CTV, Paid Social, and Retail Media. The first step is to derive the diminishing returns curve for each channel. The second is to split the budget into increments; in this example, $10K, $20K and $20K.
“The optimizer never asks which channel performed best. It asks which curve is steepest right now.”
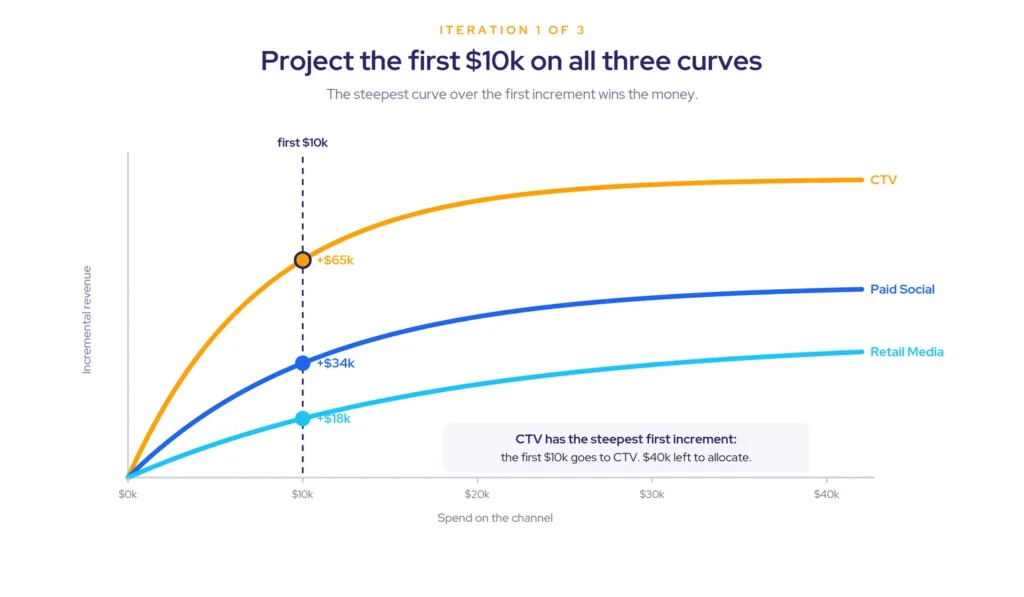
Iteration 1: the first $10k
Project the first $10k on all three curves and compare the returns. CTV’s curve projects $65k of incremental revenue, Paid Social’s $34k, Retail Media’s $18k. CTV has the steepest first increment, so the first $10k goes to CTV.
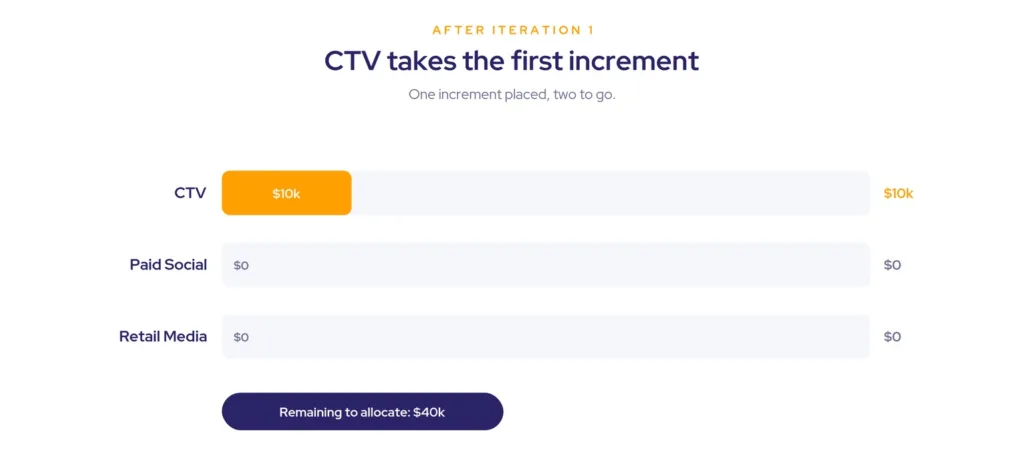
After iteration 1: CTV holds $10k, Paid Social and Retail Media hold nothing, and $40k remains to allocate.
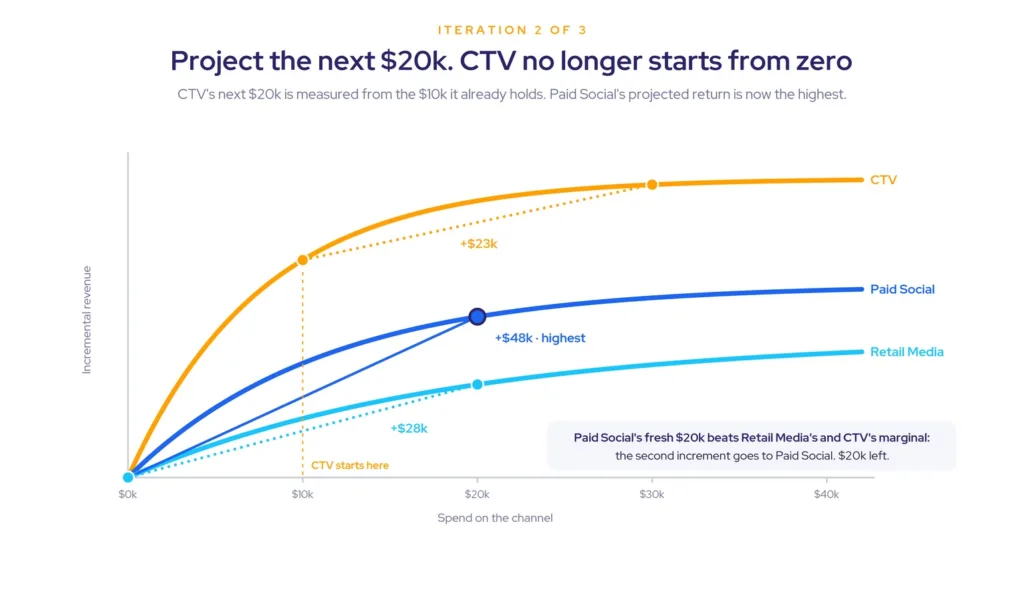
Iteration 2: the next $20k
Project the next $20k on all three curves and compare the returns on the vertical axis. One detail changes everything: CTV no longer starts from zero. Its projection is measured from the $10k it already holds, so what the CTV curve returns is the marginal revenue of an additional $20k on top of the first $10k.
Comparing the three projected returns, Paid Social’s $48k is the highest, ahead of Retail Media’s $28k and CTV’s marginal $23k. The second increment goes to Paid Social.
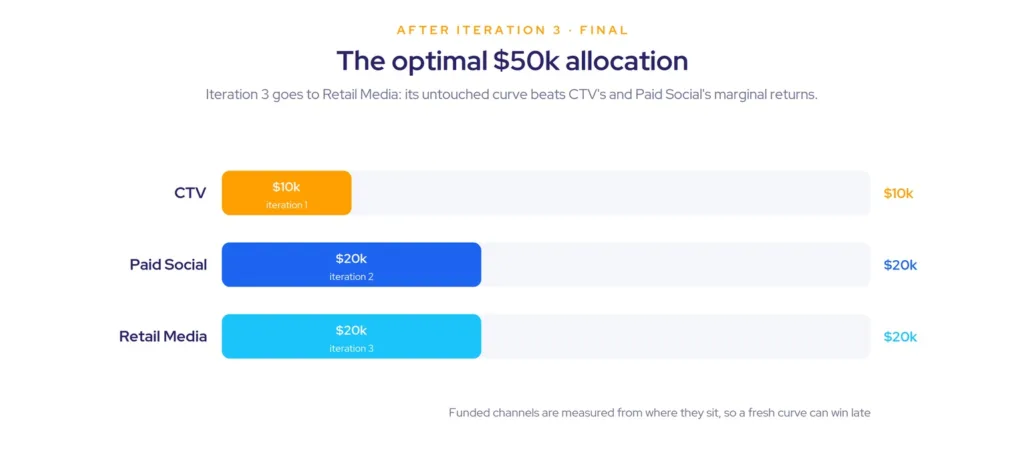
Iteration 3: the last $20k
The same procedure decides the final $20k, with each channel measured from its current position. CTV would return a marginal $23k and Paid Social a marginal $8k, because both are projected from the spend they already hold. Retail Media’s curve is still untouched, so its fresh $20k projection of $28k is now the highest. The last increment goes to Retail Media.
The final optimal allocation: CTV gets $10k from iteration 1, Paid Social gets $20k from iteration 2, and Retail Media gets $20k from iteration 3. Even the smallest channel earns its increment once the bigger curves have absorbed theirs.
Real optimizers run this logic at much finer granularity and under real constraints: a total budget, a date range, and floors and ceilings per channel so the math respects contracts and inventory. MassTer Mind is built for exactly that job. The principle does not change.
The recommended optimization process
Based on our experience, five steps make the optimization robust. They happen during modeling, not after it.
Step 1: Apply variable transformations (AdStock, carryover)
Consumers rarely buy the moment they see a campaign; there is a carryover effect to account for. Transformations like AdStock model it, and some algorithms can capture both the short-term and the long-term effect of advertising.
Step 2: Add diminishing returns functions
AdStock is a linear function. It does not produce the concavity optimization requires, so a functional form that does, the exponential function for example, has to be applied on top. Some analysts prefer an S-shaped curve at this stage.
Step 3: Create multiple candidate curves
Varying the saturation parameter in the chosen function produces multiple candidate curves. Each one represents a different saturation level to be tested at the selection stage.
Step 4: Apply a model selection algorithm
Selection is where the right curve is chosen to go into optimization, considering all the other factors in the model. The curves have to make sense on visual inspection: neither highly saturated nor not saturated at all.
“A curve that never saturates tells the optimizer to spend everything on one channel. No business signs off on that.”
A fully saturated curve has the opposite problem: it tells the optimizer to spend nothing there. Neither reflects reality, which is why curve construction belongs inside the modeling process. We have written up why building diminishing return curves after modeling is a mistake.
Step 5: Optimize the budget
Once the curves that best fit the data are selected, they feed into the optimization to allocate the budget, exactly as in the walkthrough above.
Common mistakes when optimizing MMMs
Forgetting the business perspective
Optimization is not an exercise for a closed room. Input from the business and the media planners is what makes the output implementable, because reality carries constraints the data does not show. A channel with limited inventory, for example, needs a ceiling on how much the optimizer is allowed to place there.
Asking the opinion of the manager or the subject-matter experts is advisable; they usually hold exactly the constraint knowledge the algorithm is missing. It is one of the most common failure points in MMM projects generally.
Not iterating enough
“Modeling and optimization are not sequential steps. Treat them as iterative or expect bad surprises.”
Here is how the sequential version fails. The model is built, ROI and contribution are reported, and the business asks for an optimization on top. Only then does the team discover that some channels are fully saturated and others not at all.
An optimizer faced with those curves does the only thing it can: zero on the saturated channels, everything on the rest. No business accepts that plan.
The fix is to keep an eye on the optimization results while the model is still being built, and iterate until modeling, optimization, contribution and ROI all make sense together. The project is finished when all four agree, not before.
The backbone is the curve
The backbone of any Marketing Mix Modeling optimization exercise is the definition of the diminishing returns curves. Transform the variables, apply the carryover, build in diminishing returns, create multiple sensible candidates, and use model selection to find the curve that deserves to drive the allocation.
What that discipline is worth in production, with client numbers, is covered in our companion piece on marketing mix optimization and where the next dollar should go.
The optimizers will keep getting faster. The teams that win the next decade will be the ones whose curves deserve the confidence the algorithm places in them.
For the full workflow behind these ideas, from data processing to reading the curves, see our Comprehensive Marketing Mix Modeling Guide.
Frequently asked questions about Marketing Mix Modeling optimization
Optimization uses the diminishing returns curve of each channel, produced during modeling, to allocate budget increment by increment. Each increment goes to the channel whose curve is steepest at its current spend level, the slopes are recomputed, and the process repeats until the budget is spent. The result is the allocation with the highest total projected return under the constraints set.
A diminishing returns curve maps spend on a channel to the incremental revenue it generates. The curve is concave or S-shaped: each additional dollar earns less than the one before, and at complete saturation the curve goes flat, meaning the next dollar buys almost nothing. These curves are the backbone of any optimization exercise.
AdStock is a transformation that models the carryover effect of advertising, since consumers rarely buy the moment they see a campaign. AdStock alone is linear, so a diminishing returns function has to be applied on top of it to produce the concave shape optimization requires. Skipping that step leaves the optimizer with curves it cannot allocate against sensibly.
The total budget is divided into blocks, and each block is projected onto every channel’s curve from that channel’s current spend level. The block goes to the channel with the highest projected marginal return, the positions update, and the next block is projected again. Channels that already hold budget are measured from where they sit, not from zero.
Because the optimization exposes curve problems the model statistics do not. If curves turn out fully saturated or entirely unsaturated only after the model is reported, the optimizer will produce an allocation no business accepts, and the modeling has to be redone. Checking optimization results during modeling catches this early, and the project is only done when both make sense together.
Two shapes disqualify a curve: one that never saturates, which tells the optimizer to pour the entire budget into that single channel, and one that is already flat, which tells it to spend nothing there. Neither reflects reality. Curves should be concave or S-shaped with a visible but not extreme saturation level, chosen during model selection.
About MASS Analytics.
MASS Analytics is a Marketing Mix Modeling software and services provider. The MassTer platform covers the full MMM workflow, from data preparation and modeling through optimization, simulation, and always-on refresh, and is used by brands and agencies to turn marketing measurement into budget decisions.
- ✓Optimization sits in the deployment phase of the MMM workflow. It is the step that turns measurement into budget decisions.
- ✓The engine is each channel’s diminishing returns curve, not its average ROI. Budget flows increment by increment to whichever curve is steepest.
- ✓High ROI does not mean spend more. A saturated channel earns little on its next dollar, whatever its average says.
- ✓Curves are built during modeling, not bolted on afterwards. Modeling and optimization have to be iterated together until both make sense.