
As you explore your Marketing Mix Modeling data, you’ll often face charts that look like this:
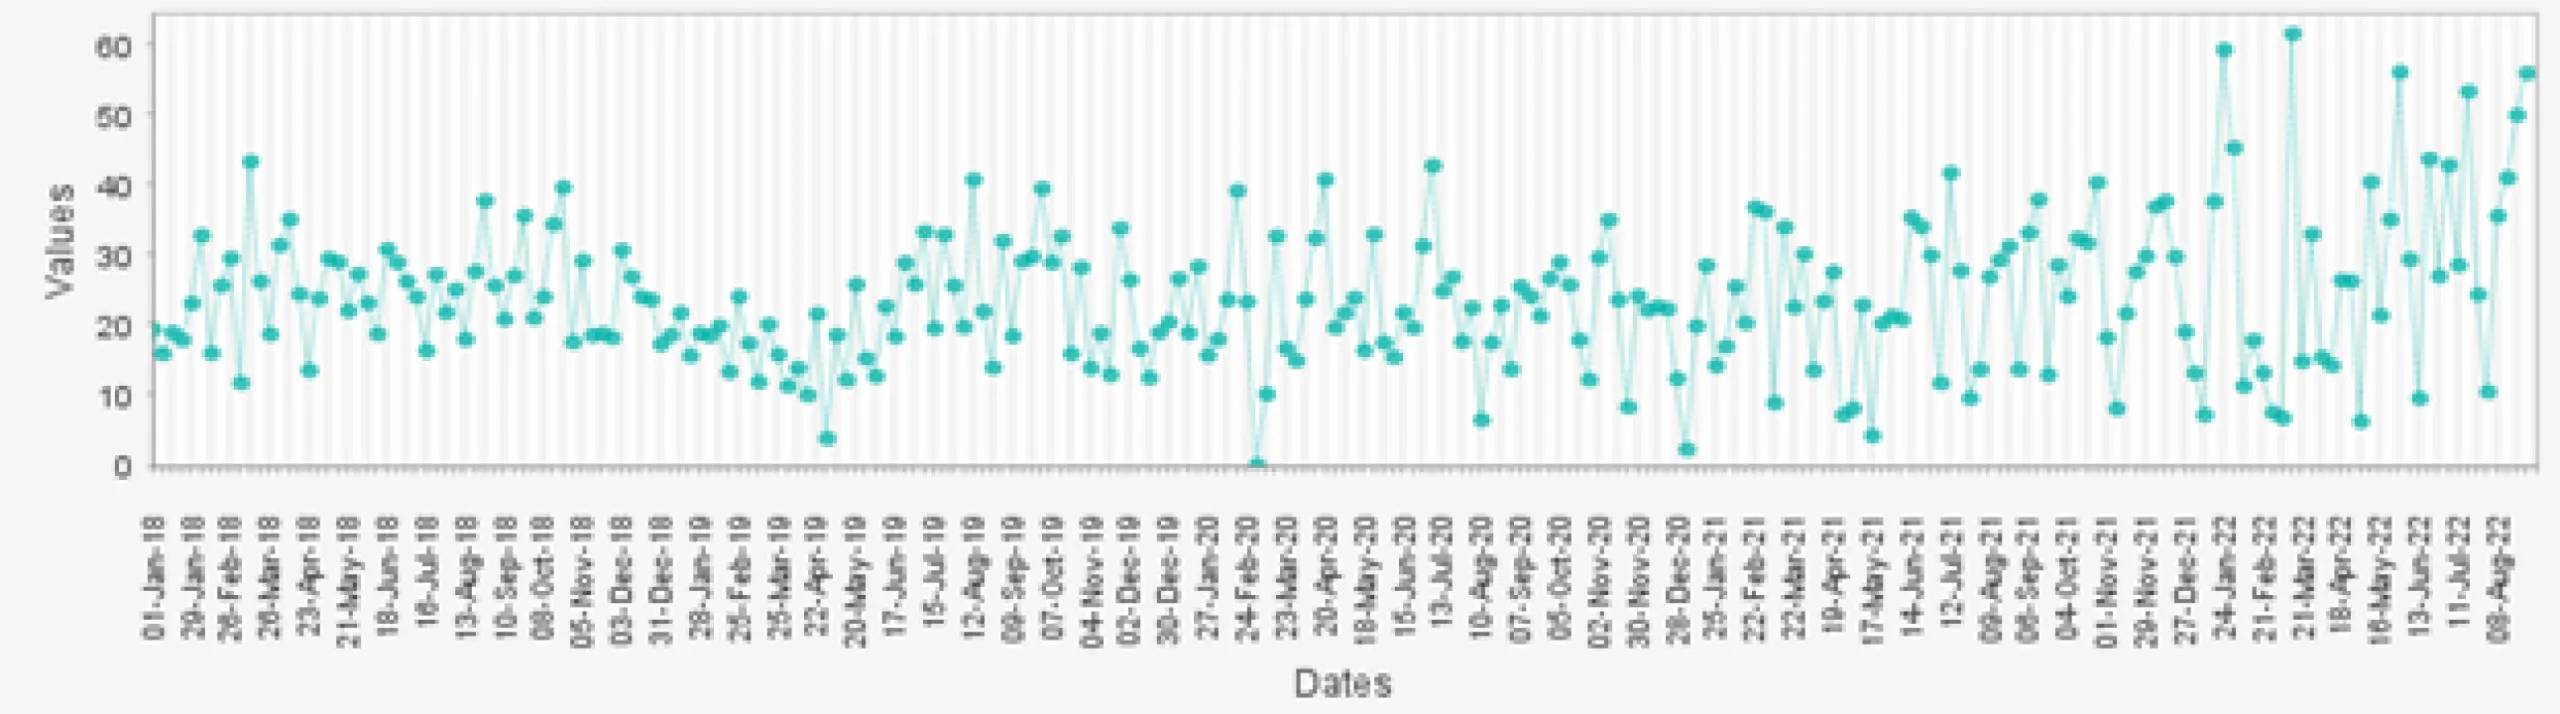
Figure 1 Messy MMM Chart
That looks like a mess. There’s too much variability to make sense of it. So, what can you do in this case? You can smooth the data.
What is Data Smoothing?
Data smoothing is about finding hidden trends and patterns by toning down the noisy parts. In our previous chart, if we smooth our data, we get this:
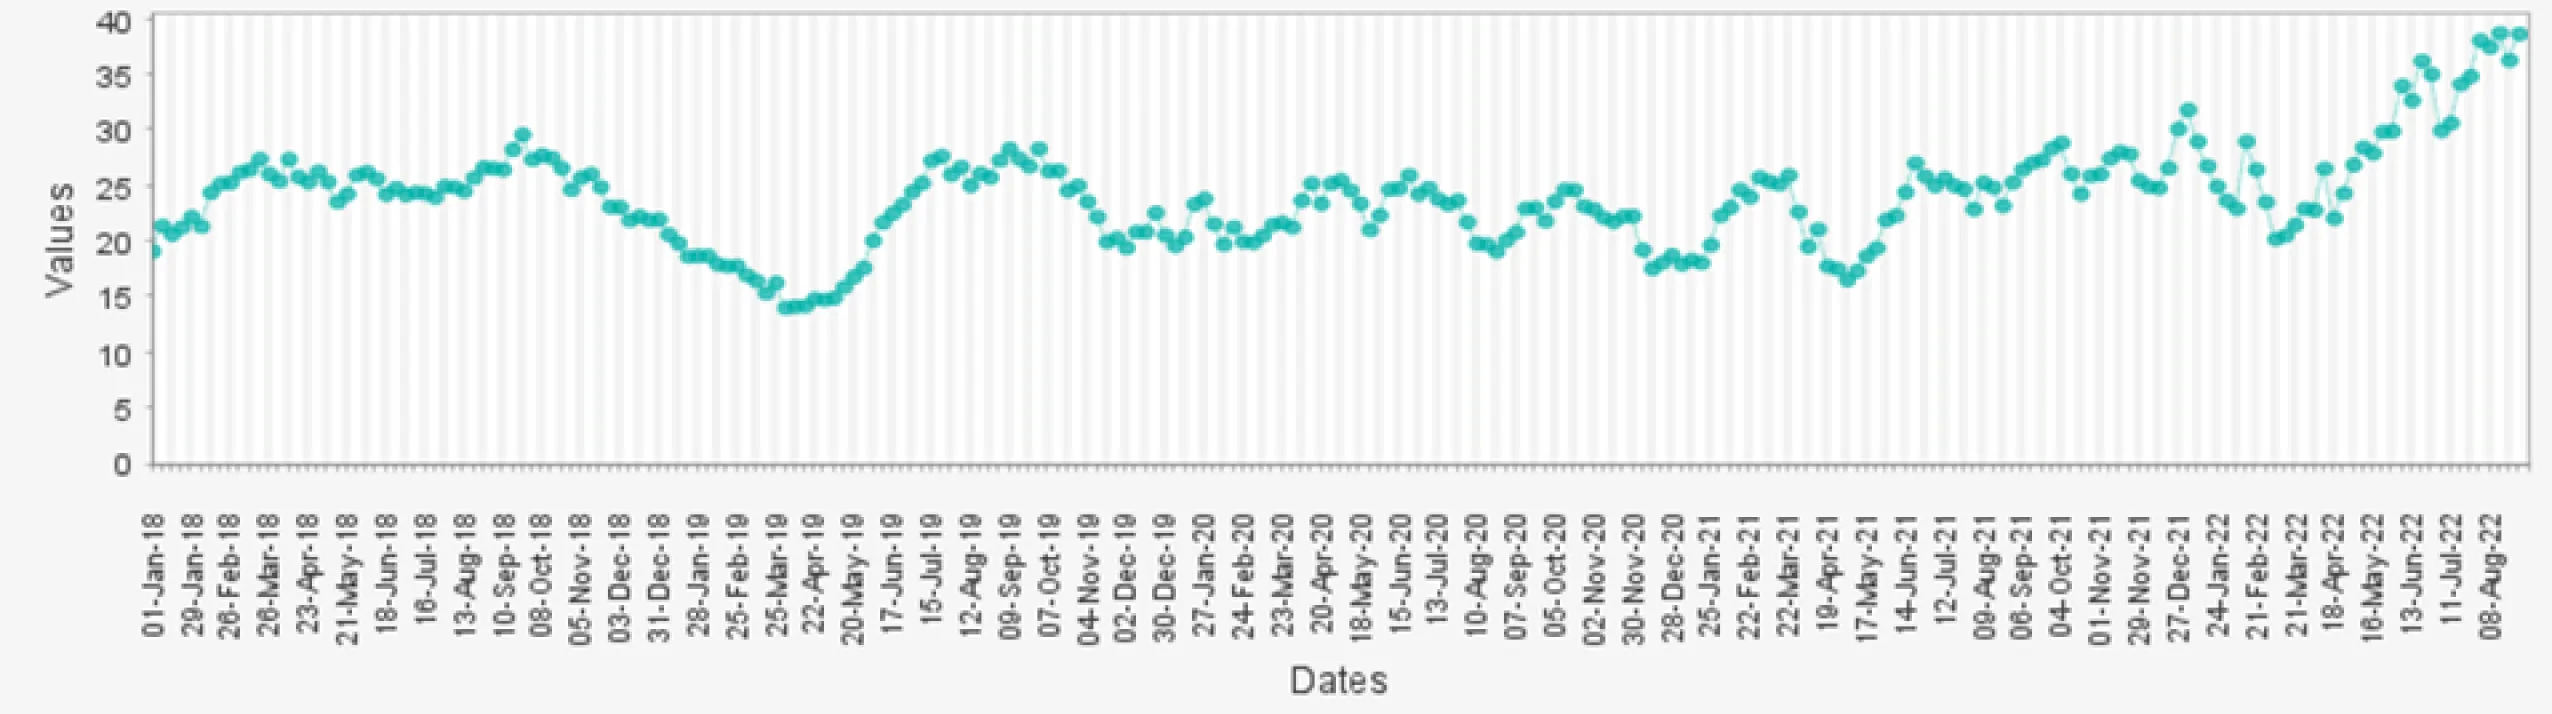
Figure 2 Smooth MMM Chart
That’s much cleaner! Now we can see patterns emerging and we can extrapolate some insights based on what we know about the business.
Benefits of Data Smoothing
Smoothing makes data less noisy and thus easier to model. Raw data often contain random fluctuations and irregularities that can obscure underlying trends. Smoothing techniques help filter out this noise, making it easier to identify meaningful patterns like long-term trends, seasonality, and other variations that might be hidden in noisy data.
Limitations of Data Smoothing
When applying data smoothing techniques in Marketing Mix Modeling, it’s essential to strike a balance between reducing noise and maintaining the integrity of the original data.
Over-smoothing can result in the loss of important information, while under-smoothing may not effectively reveal the underlying patterns. The choice of technique depends on the characteristics of the data, the level of noise present, and the desired level of detail in the smoothed representation. It’s also a good practice to validate the effectiveness of the chosen smoothing technique using techniques such as cross-validation or comparing the smoothed results to known events or trends in the market.
Common Data Smoothing Methods for MMM
Moving Average
The moving average is a simple technique that involves calculating the average of a specific number of data points within a given window. This average is then used as the smoothed value for that point.

How it works is that you’ll be sliding a window, entry by entry, over the entire variable, and you’ll be computing the local average within that window. Like this:
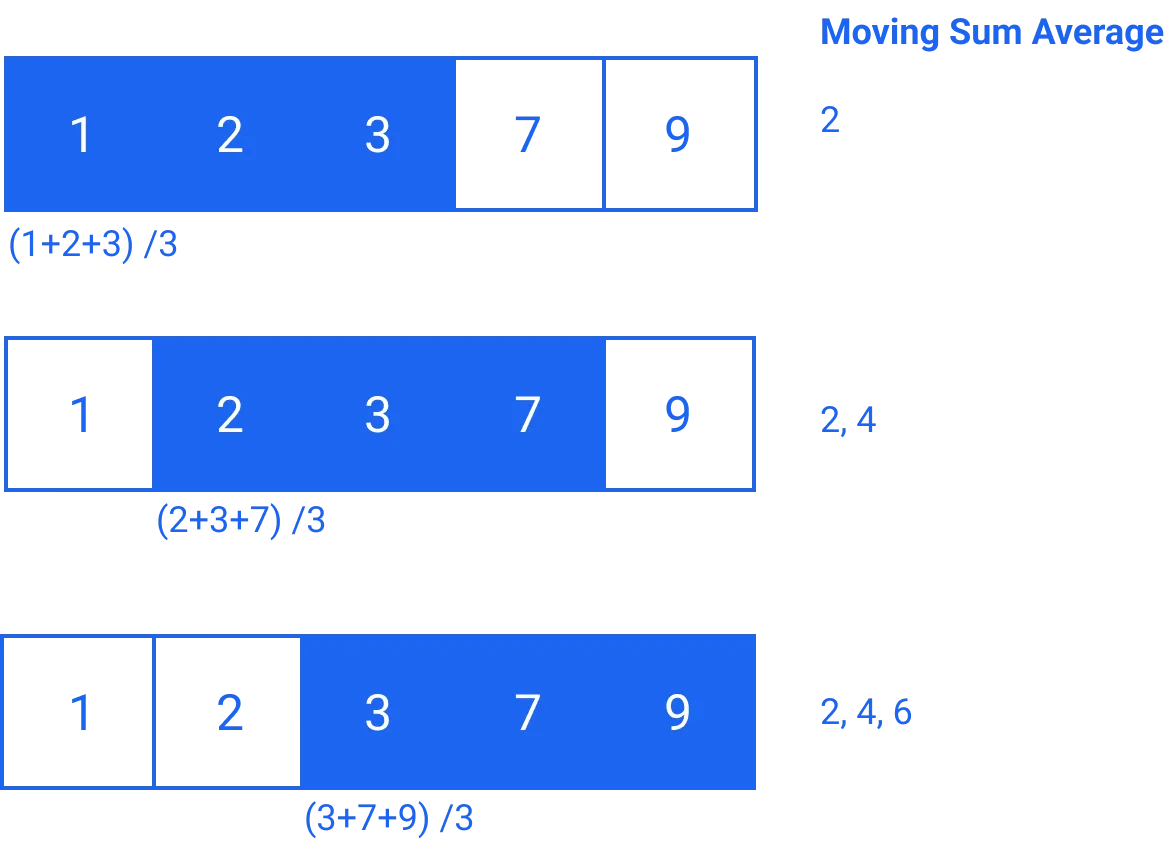
Figure 3 Sliding Window Method
There are two variations of the moving average. There is the standard moving average, where the target observation would be at the start of your window, and there’s the centered moving average, where your target observation would be located at the center of the sliding window.
You can adjust the size of the window depending on your needs. Here, and using the software MassTer, we have created two versions of the moving average: one with a sliding window of 50 periods, and another with a sliding window of 10 periods.
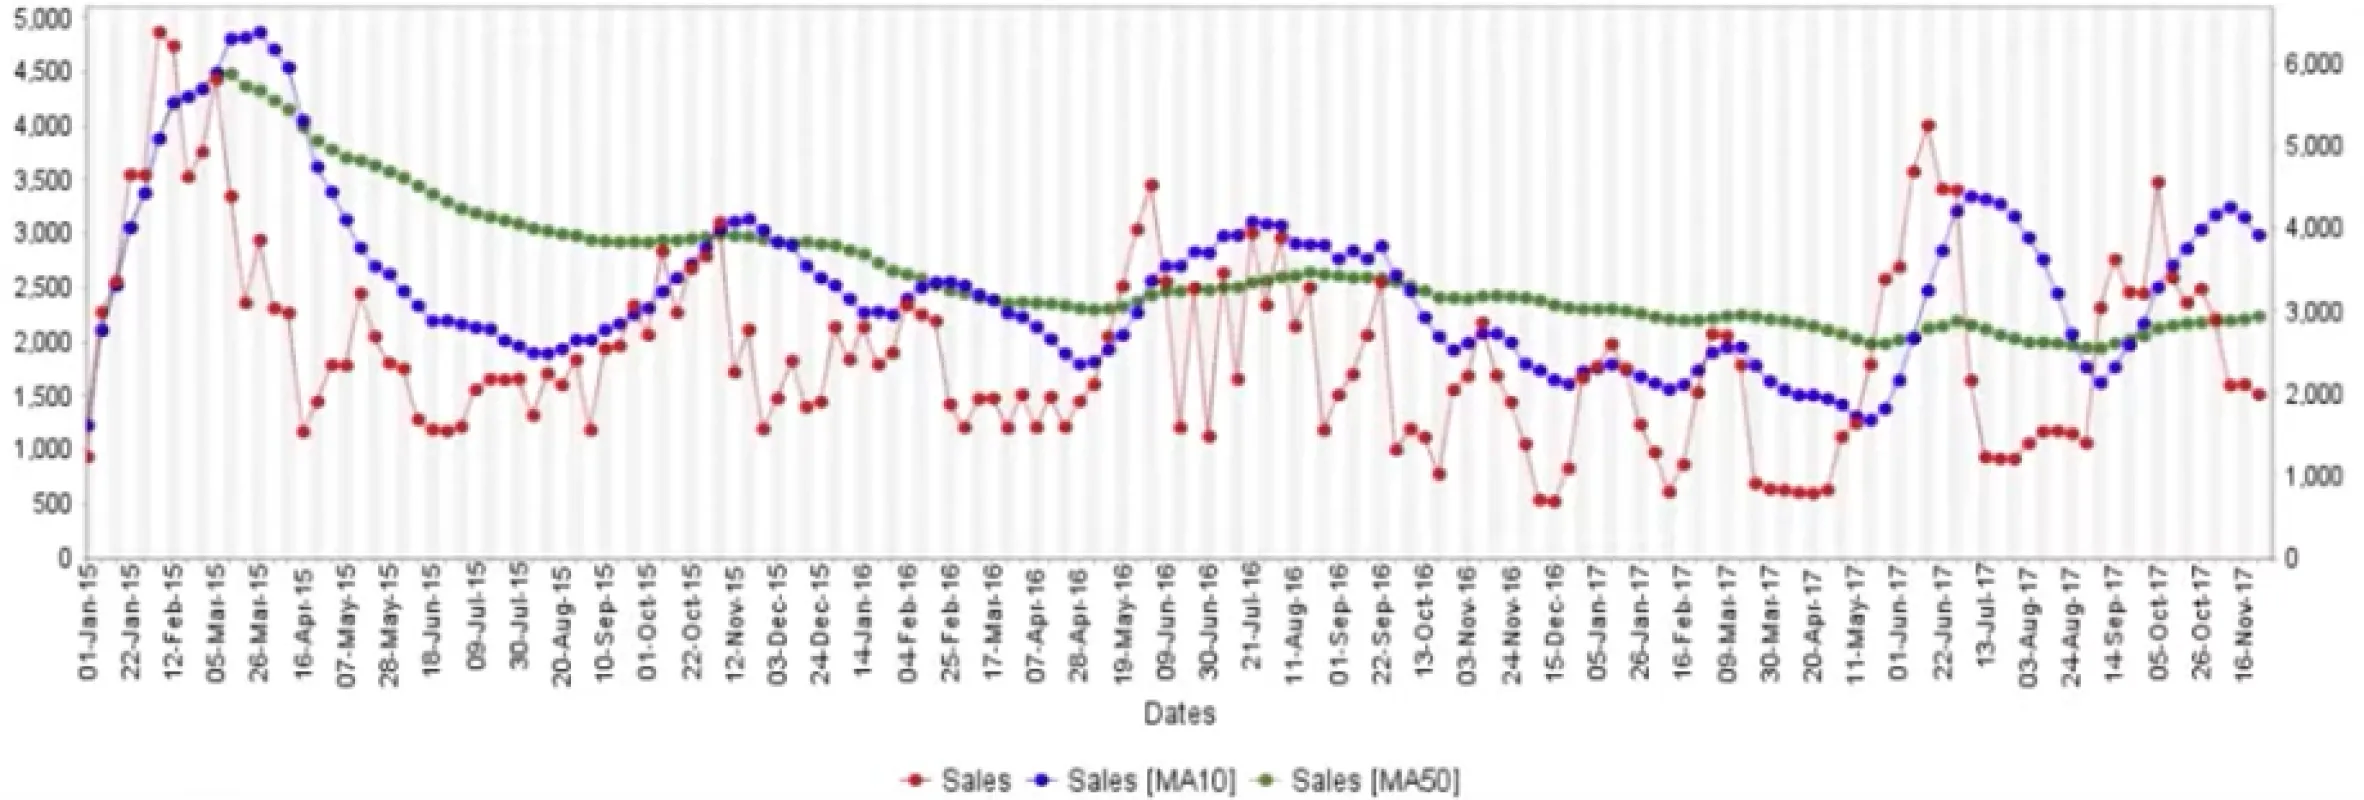
Figure 4 Moving Average Illustration
You can see that when you opt for a large window, you can obtain a smoother version of your data set. Here the choice of how large the window is will depend on what you want to get as an output. So, if you want to smooth out your data well, go for a large window.
Median Filter
Unlike the moving average, this processor replaces each data entry with the median (instead of the average) of neighboring entries. As a reminder, the median is the middle value after all the entries in the window are sorted numerically.
Compared to the moving average, the median filter is less vulnerable to data outliers or extreme cases.
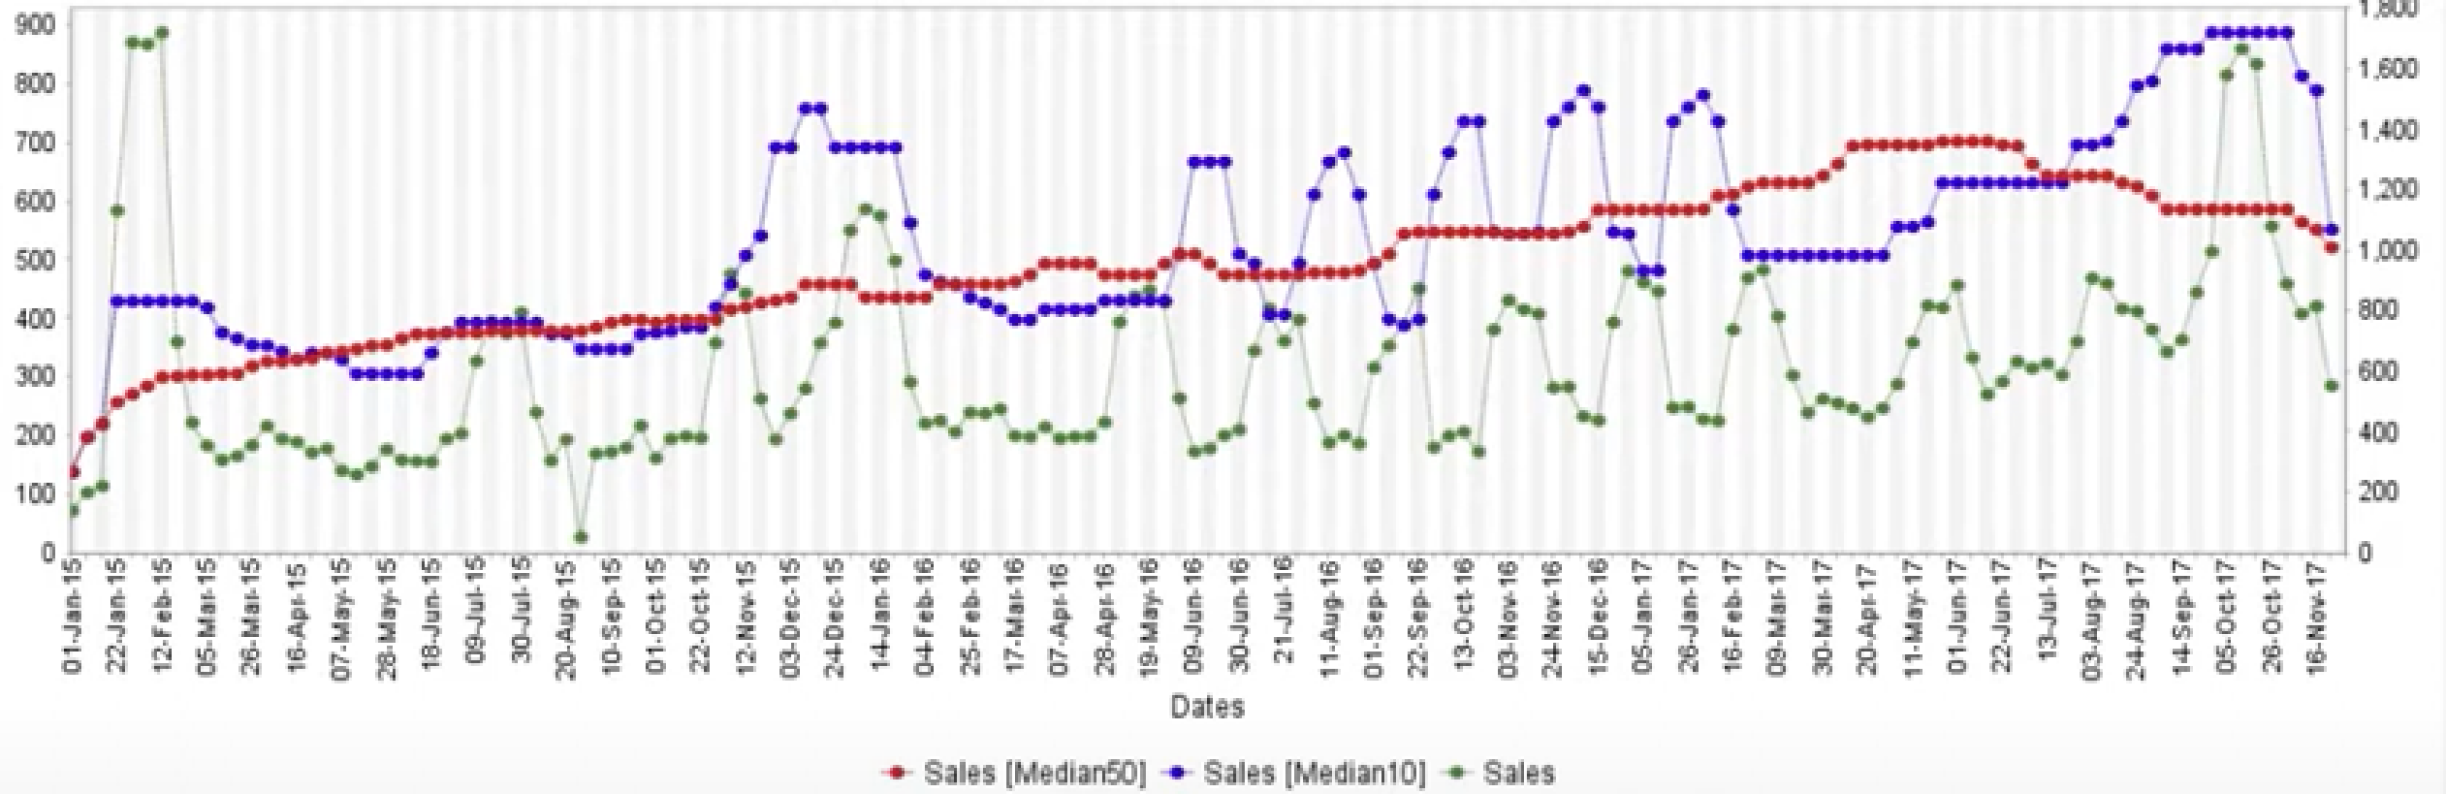
Figure 5 Median Filter Illustration
In the chart above, we have used the median filter to smooth the sales data again. Like the moving average, you can adjust your sliding window. As the value you define gets larger, the output you will get will be smoother.
Which one should you use?
Generally, we use the median filter when we want to remove outliers from our data. On the other hand, the moving average is more appropriate when working with high-frequency and volatile data. And sometimes, the choice doesn’t matter because both will smooth your data effectively.
Within the realm of Marketing Mix Modeling, Data Smoothing predominantly finds application in crafting seasonal and market variables. An illustrative instance involves deriving seasonality from a blend of sales data (own sales and competitor sales), utilizing one of the smoothing techniques described in this article.
Conclusion
In conclusion, Data Smoothing serves as a valuable tool in navigating the complexities of Marketing Mix Modeling. By transforming messy charts into streamlined representations, these techniques will allow you to extract actionable insights from your data. However, a nuanced approach is necessary to ensure that the process of smoothing strikes the right balance between noise reduction and data integrity.
Whether through the application of the Moving Average or the Median Filter, the journey toward accurate and meaningful data interpretation is paved by the art and science combination in MMM.